| Date | Price $ | Result % | Candle Name | Side |
|---|---|---|---|---|
| 001 07 Feb 2024 | Sell Price: 652.73 | Profit: Open Day1 ($ 651.77) | Dark Cloud Cover | Sell |
| 002 18 Dec 2023 | Sell Price: 568.23 | Profit: Open Day2 ($ 568.00) | Dark Cloud Cover | Sell |
| 003 17 Nov 2023 | Buy Price: 480.98 | Loss: Close Day2 ($ 466.23) | Abandoned Baby | Buy |
| 004 16 Nov 2023 | Sell Price: 474.36 | Profit: Open Day2 ($ 467.69) | Abandoned Baby | Sell |
| 005 24 Oct 2023 | Sell Price: 406.35 | Profit: Close Day1 ($ 399.15) | Engulfing | Sell |
| 006 13 Jul 2023 | Sell Price: 458.43 | Profit: Close Day1 ($ 445.45) | Abandoned Baby | Sell |
| 007One Year Average | Both Sides Result for 6 Signals |
Profit: $ 13.29 ($ 2.22 / Signal) |
All of Them | Buy + Sell |
| Simple Moving Averages (SMA) Period | Value $ | Signal | Exponential Moving Averages (EMA) Period | Value $ | Signal | |
|---|---|---|---|---|---|---|
| 2 | 665.62 | BUY | 2 | 665.73 | BUY | |
| 3 | 661.66 | BUY | 3 | 666.49 | BUY | |
| 5 | 673.13 | SELL | 5 | 668.20 | SELL | |
| 8 | 675.32 | SELL | 8 | 668.67 | SELL | |
| 13 | 660.82 | BUY | 13 | 669.29 | SELL | |
| 21 | 669.65 | SELL | 21 | 671.51 | SELL | |
| 34 | 683.38 | SELL | 34 | 672.12 | SELL | |
| 55 | 679.26 | SELL | 55 | 663.51 | BUY | |
| 90 | 647.98 | BUY | 90 | 638.64 | BUY | |
| 200 | 545.79 | BUY | 200 | 567.78 | BUY |
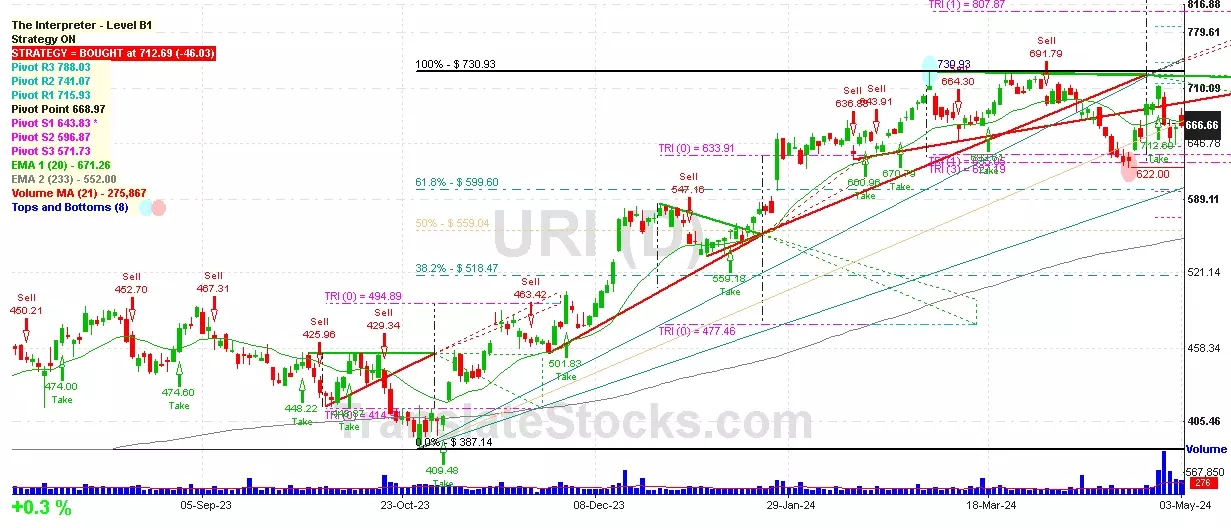
United Rentals Inc
IPO: 1997-12-18
Ticker: URIIndices: S&P 500,
Exchange: New York Stock Exchange, Inc. (US - USD)
Website: https://www.unitedrentals.com/
Phone:
Common Stock
Trade & Services (
Services-equipment Rental & Leasing, Nec

 Click to Enlarge