| Date | Price $ | Result % | Candle Name | Side |
|---|---|---|---|---|
| 001 09 Apr 2024 | Buy Price: 404.48 | Loss: Close Day2 ($ 400.23) | Abandoned Baby | Buy |
| 002 02 Apr 2024 | Sell Price: 409.42 | Profit: Close Day1 ($ 408.81) | Abandoned Baby | Sell |
| 003 27 Mar 2024 | Sell Price: 417.32 | Loss: Close Day2 ($ 420.48) | Engulfing | Sell |
| 004 27 Mar 2024 | Sell Price: 417.07 | Loss: Close Day2 ($ 420.48) | Dark Cloud Cover | Sell |
| 005 22 Mar 2024 | Sell Price: 415.66 | Loss: Close Day2 ($ 418.46) | Dark Cloud Cover | Sell |
| 006 13 Mar 2024 | Buy Price: 413.20 | Profit: Open Day1 ($ 414.01) | Abandoned Baby | Buy |
| 007 30 Aug 2023 | Sell Price: 350.76 | Profit: Open Day1 ($ 349.85) | Dark Cloud Cover | Sell |
| 008 14 Jun 2023 | Sell Price: 340.57 | Loss: Close Day2 ($ 347.89) | Engulfing | Sell |
| 009 14 Jun 2023 | Sell Price: 340.96 | Loss: Close Day2 ($ 347.89) | Dark Cloud Cover | Sell |
| 010 08 Jun 2023 | Buy Price: 332.58 | Profit: Open Day1 ($ 333.52) | Engulfing | Buy |
| 011 22 May 2023 | Sell Price: 339.97 | Profit: Close Day1 ($ 333.51) | Engulfing | Sell |
| 012One Year Average | Both Sides Result for 11 Signals |
Loss: $ -18.15 ($ -1.65 / Signal) |
All of Them | Buy + Sell |
| Simple Moving Averages (SMA) Period | Value $ | Signal | Exponential Moving Averages (EMA) Period | Value $ | Signal | |
|---|---|---|---|---|---|---|
| 2 | 397.59 | SELL | 2 | 397.96 | SELL | |
| 3 | 398.65 | SELL | 3 | 398.38 | SELL | |
| 5 | 400.15 | SELL | 5 | 398.57 | SELL | |
| 8 | 397.70 | SELL | 8 | 398.70 | SELL | |
| 13 | 397.50 | SELL | 13 | 399.66 | SELL | |
| 21 | 402.08 | SELL | 21 | 401.99 | SELL | |
| 34 | 406.53 | SELL | 34 | 405.31 | SELL | |
| 55 | 412.48 | SELL | 55 | 407.39 | SELL | |
| 90 | 416.21 | SELL | 90 | 404.73 | SELL | |
| 200 | 383.54 | BUY | 200 | 385.82 | BUY |
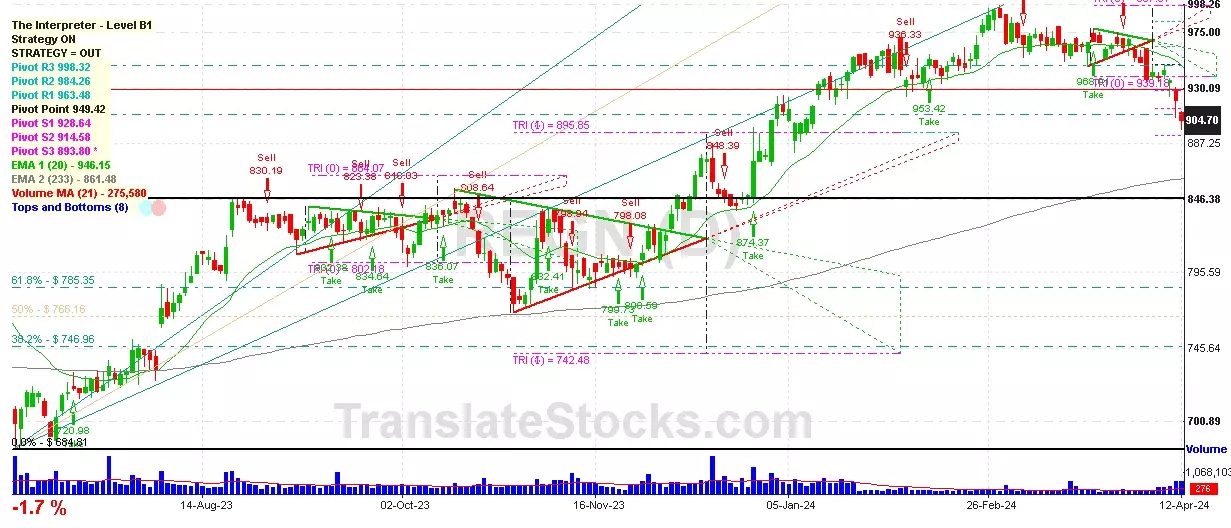
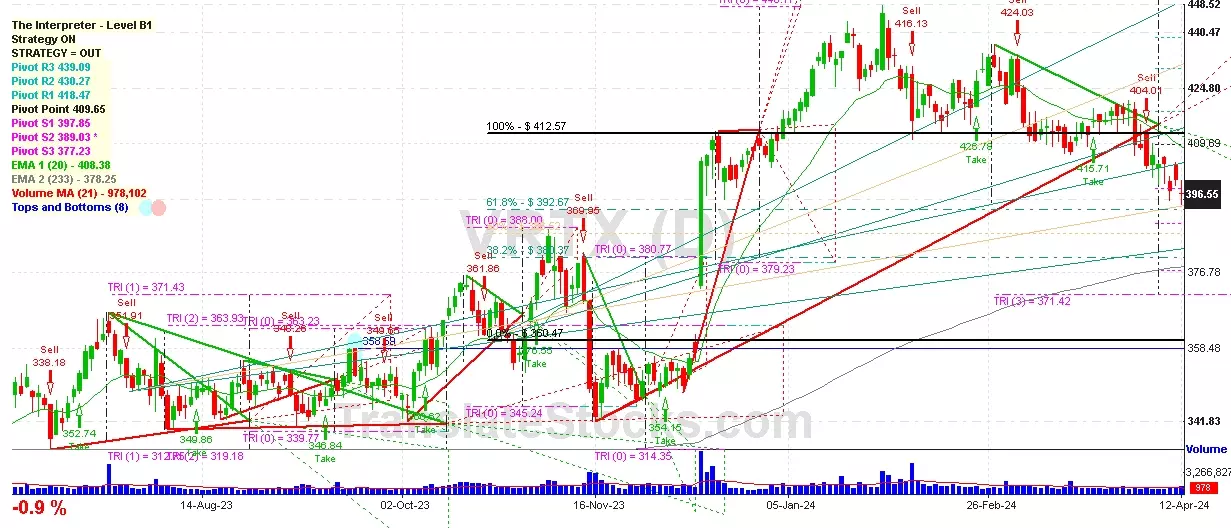
Vertex Pharmaceuticals Inc
IPO: 1991-07-24
Ticker: VRTXIndices: S&P 500,
Nasdaq 100,
Exchange: Nasdaq Nms - Global Market (US - USD)
Website: https://www.vrtx.com/
Phone:
Common Stock
Life Sciences (
Pharmaceutical Preparations

 Click to Enlarge