| Date | Price $ | Result % | Candle Name | Side |
|---|---|---|---|---|
| 001 14 Mar 2024 | Buy Price: 51.88 | Profit: Close Day1 ($ 51.99) | Piercing Line | Buy |
| 002 09 Feb 2024 | Buy Price: 58.16 | Profit: Open Day1 ($ 58.20) | Engulfing | Buy |
| 003 09 Feb 2024 | Buy Price: 58.17 | Profit: Open Day1 ($ 58.20) | Piercing Line | Buy |
| 004 28 Dec 2023 | Buy Price: 61.89 | Profit: Close Day1 ($ 61.91) | Engulfing | Buy |
| 005 19 Dec 2023 | Sell Price: 62.12 | Profit: Close Day1 ($ 61.31) | Dark Cloud Cover | Sell |
| 006 05 Dec 2023 | Sell Price: 61.03 | Loss: Close Day2 ($ 61.55) | Engulfing | Sell |
| 007 08 Jun 2023 | Sell Price: 64.14 | Profit: Open Day1 ($ 63.92) | Dark Cloud Cover | Sell |
| 008One Year Average | Both Sides Result for 7 Signals |
Profit: $ 0.71 ($ 0.10 / Signal) |
All of Them | Buy + Sell |
| Simple Moving Averages (SMA) Period | Value $ | Signal | Exponential Moving Averages (EMA) Period | Value $ | Signal | |
|---|---|---|---|---|---|---|
| 2 | 54.49 | SELL | 2 | 54.34 | SELL | |
| 3 | 54.77 | SELL | 3 | 54.51 | SELL | |
| 5 | 54.91 | SELL | 5 | 54.57 | SELL | |
| 8 | 54.53 | SELL | 8 | 54.46 | SELL | |
| 13 | 54.02 | SELL | 13 | 54.24 | SELL | |
| 21 | 53.96 | SELL | 21 | 54.02 | SELL | |
| 34 | 53.32 | BUY | 34 | 54.11 | SELL | |
| 55 | 54.29 | SELL | 55 | 54.77 | SELL | |
| 90 | 56.89 | SELL | 90 | 55.91 | SELL | |
| 200 | 58.43 | SELL | 200 | 58.53 | SELL |
Xcel Energy Inc
IPO: 1949-02-28
Ticker: XELIndices: S&P 500,
Nasdaq 100,
Exchange: Nasdaq Nms - Global Market (US - USD)
Website: https://www.xcelenergy.com/
Phone:
Common Stock
Energy & Transportation (
Electric & Other Services Combined

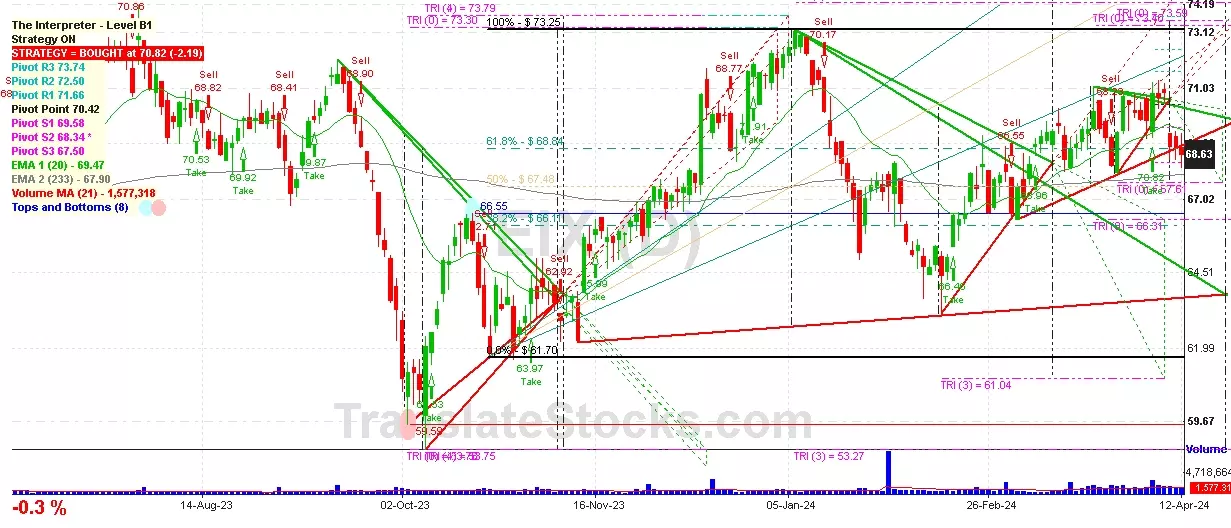
 Click to Enlarge
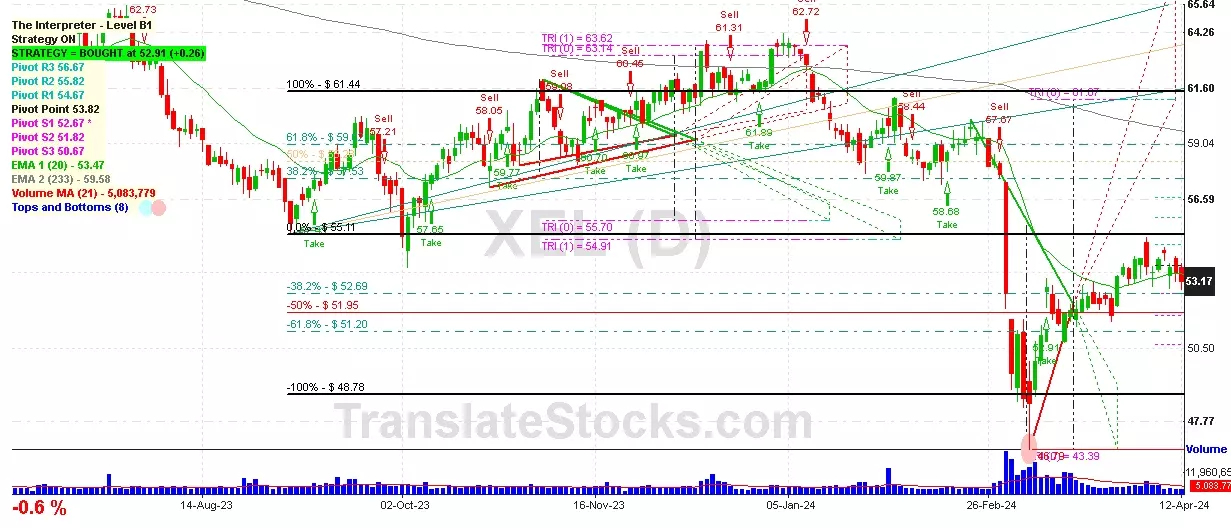