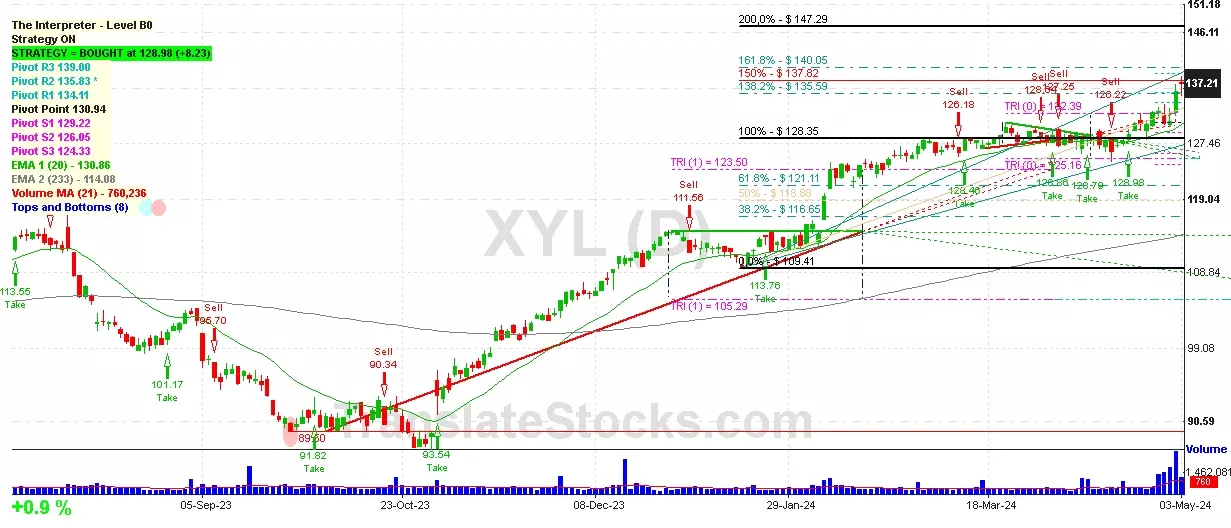
Hey Friend, I'm analysing XYLEM INC (XYL), and it is between the Support of $ 135.83 (PivotR2) and the Resistance of $ 137.82 (150% of Fibonacci). The stock is also approaching the line of PivotR2 at $ 135.83, and if it goes below this line it could reach the next Support of 138.2% of Fibonacci at $ 135.59.

| Date | Price $ | Result % | Candle Name | Side |
|---|---|---|---|---|
| 001 11 Apr 2024 | Buy Price: 128.79 | Profit: Open Day2 ($ 129.43) | Abandoned Baby | Buy |
| 002 04 Apr 2024 | Sell Price: 127.25 | Loss: Close Day2 ($ 127.75) | Engulfing | Sell |
| 003 16 Feb 2024 | Sell Price: 123.79 | Profit: Open Day1 ($ 122.89) | Abandoned Baby | Sell |
| 004 31 Jan 2024 | Sell Price: 112.44 | Loss: Close Day2 ($ 115.42) | Engulfing | Sell |
| 005 08 Dec 2023 | Buy Price: 106.38 | Profit: Open Day1 ($ 106.47) | Engulfing | Buy |
| 006 07 Nov 2023 | Buy Price: 96.77 | Profit: Open Day1 ($ 97.05) | Engulfing | Buy |
| 007 11 Sep 2023 | Buy Price: 96.66 | Profit: Open Day2 ($ 96.93) | Abandoned Baby | Buy |
| 008 17 Jul 2023 | Buy Price: 110.63 | Profit: Open Day1 ($ 110.65) | Engulfing | Buy |
| 009 29 Jun 2023 | Buy Price: 111.40 | Profit: Open Day1 ($ 112.23) | Engulfing | Buy |
| 010 29 Jun 2023 | Buy Price: 111.34 | Profit: Open Day1 ($ 112.23) | Piercing Line | Buy |
| 011 20 Jun 2023 | Sell Price: 113.25 | Profit: Open Day1 ($ 112.50) | Abandoned Baby | Sell |
| 012 13 Jun 2023 | Buy Price: 110.82 | Profit: Open Day1 ($ 111.26) | Engulfing | Buy |
| 013 12 Jun 2023 | Sell Price: 108.82 | Profit: Open Day1 ($ 108.74) | Engulfing | Sell |
| 014One Year Average | Both Sides Result for 13 Signals |
Profit: $ 1.71 ($ 0.13 / Signal) |
All of Them | Buy + Sell |
| Simple Moving Averages (SMA) Period | Value $ | Signal | Exponential Moving Averages (EMA) Period | Value $ | Signal | |
|---|---|---|---|---|---|---|
| 2 | 136.60 | BUY | 2 | 136.25 | BUY | |
| 3 | 134.72 | BUY | 3 | 135.39 | BUY | |
| 5 | 133.49 | BUY | 5 | 134.21 | BUY | |
| 8 | 132.64 | BUY | 8 | 133.06 | BUY | |
| 13 | 130.93 | BUY | 13 | 131.87 | BUY | |
| 21 | 129.88 | BUY | 21 | 130.74 | BUY | |
| 34 | 129.36 | BUY | 34 | 129.36 | BUY | |
| 55 | 128.17 | BUY | 55 | 127.00 | BUY | |
| 90 | 122.97 | BUY | 90 | 123.05 | BUY | |
| 200 | 110.33 | BUY | 200 | 115.27 | BUY |
Xylem Inc
IPO: 2011-10-12
Ticker: XYLIndices: S&P 500,
Exchange: New York Stock Exchange, Inc. (US - USD)
Website: https://www.xylem.com/
Phone:
Common Stock
Technology (
Pumps & Pumping Equipment
 Click to Enlarge