| Date | Price $ | Result % | Candle Name | Side |
|---|---|---|---|---|
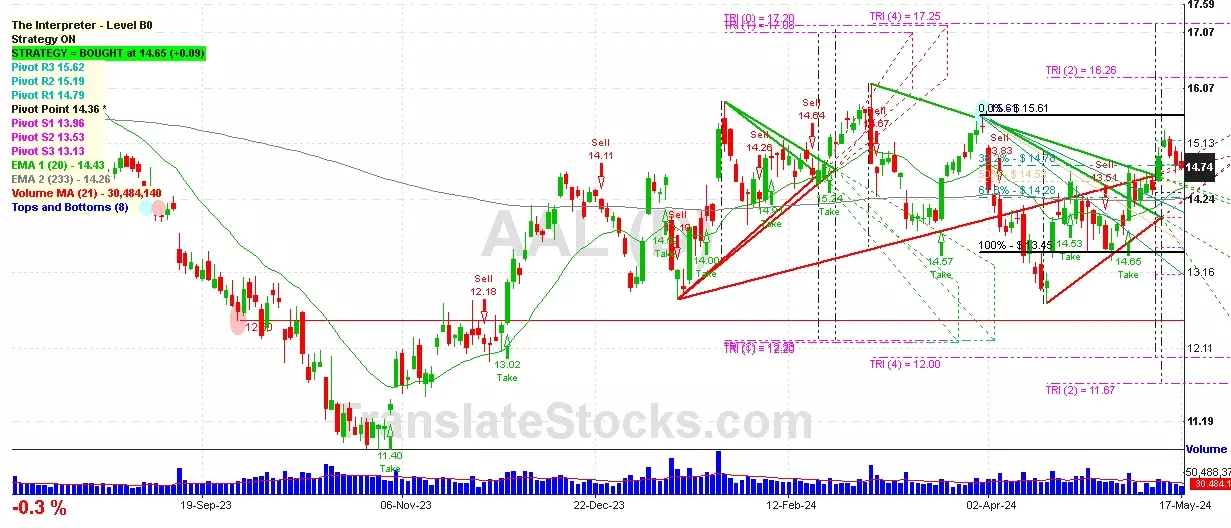
| 001 15 May 2024 | Sell Price: 14.94 | Profit: Close Day1 ($ 14.79) | Engulfing | Sell |
| 002 02 Apr 2024 | Sell Price: 14.40 | Profit: Open Day1 ($ 14.30) | Abandoned Baby | Sell |
| 003 08 Mar 2024 | Sell Price: 14.68 | Profit: Open Day1 ($ 14.60) | Engulfing | Sell |
| 004 06 Mar 2024 | Buy Price: 14.88 | Profit: Close Day1 ($ 14.90) | Abandoned Baby | Buy |
| 005 28 Feb 2024 | Sell Price: 15.46 | Loss: Close Day2 ($ 15.66) | Abandoned Baby | Sell |
| 006 16 Feb 2024 | Sell Price: 14.64 | Profit: Open Day1 ($ 14.50) | Abandoned Baby | Sell |
| 007 27 Oct 2023 | Sell Price: 10.92 | Loss: Close Day2 ($ 11.15) | Engulfing | Sell |
| 008 09 Aug 2023 | Sell Price: 15.76 | Profit: Open Day2 ($ 15.66) | Engulfing | Sell |
| 009 03 Aug 2023 | Buy Price: 15.99 | Profit: Open Day1 ($ 16.10) | Engulfing | Buy |
| 010 03 Aug 2023 | Buy Price: 15.98 | Profit: Open Day1 ($ 16.10) | Piercing Line | Buy |
| 011One Year Average | Both Sides Result for 10 Signals |
Profit: $ 0.39 ($ 0.04 / Signal) |
All of Them | Buy + Sell |
| Simple Moving Averages (SMA) Period | Value $ | Signal | Exponential Moving Averages (EMA) Period | Value $ | Signal | |
|---|---|---|---|---|---|---|
| 2 | 14.76 | SELL | 2 | 14.78 | SELL | |
| 3 | 14.82 | SELL | 3 | 14.80 | SELL | |
| 5 | 14.92 | SELL | 5 | 14.79 | SELL | |
| 8 | 14.74 | SELL | 8 | 14.70 | BUY | |
| 13 | 14.47 | BUY | 13 | 14.56 | BUY | |
| 21 | 14.30 | BUY | 21 | 14.42 | BUY | |
| 34 | 14.07 | BUY | 34 | 14.34 | BUY | |
| 55 | 14.30 | BUY | 55 | 14.30 | BUY | |
| 90 | 14.41 | BUY | 90 | 14.23 | BUY | |
| 200 | 13.80 | BUY | 200 | 14.21 | BUY |
American Airlines Group Inc
IPO: 2013-12-09
Ticker: AALIndices: S&P 500,
Exchange: Nasdaq Nms - Global Market (US - USD)
Website: https://www.aa.com/homePage.do?locale=en_USu0026pref=true
Phone:
Common Stock
Energy & Transportation (
Air Transportation, Scheduled

 Click to Enlarge