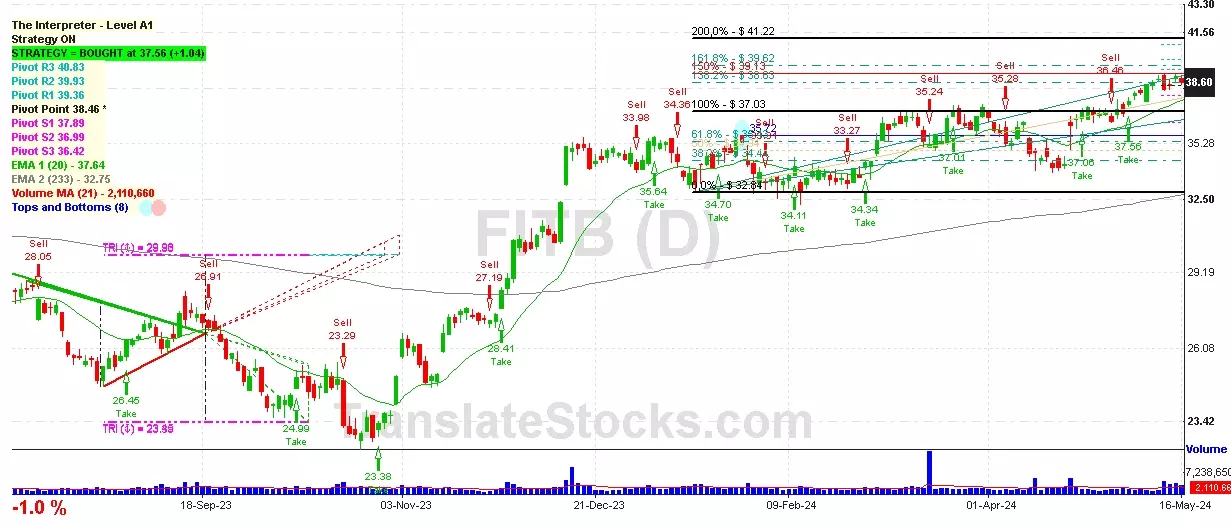
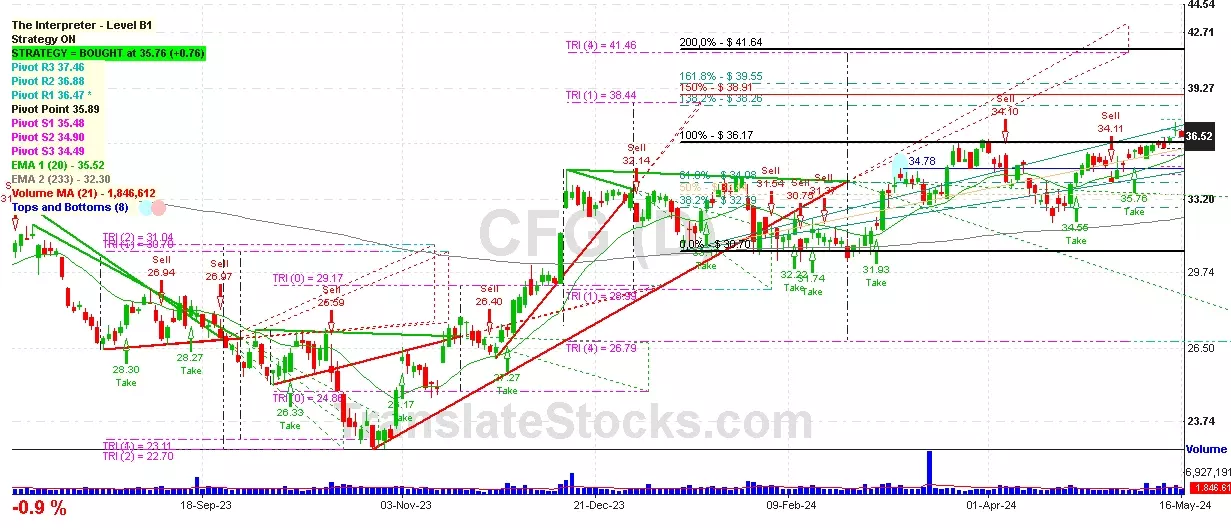
Hey Friend, I'm analysing CITIZENS FINANCIAL GROUP (CFG), and it is between the Support of $ 36.47 (PivotR1) and the Resistance of $ 36.88 (PivotR2). The stock is also approaching the line of PivotR1 at $ 36.47, and if it goes below this line it could reach the next Support of 100% of Fibonacci at $ 36.17.

| Date | Price $ | Result % | Candle Name | Side |
|---|---|---|---|---|
| 001 02 Feb 2024 | Buy Price: 32.06 | Profit: Open Day1 ($ 32.33) | Piercing Line | Buy |
| 002 02 Jan 2024 | Buy Price: 33.51 | Loss: Close Day2 ($ 32.31) | Engulfing | Buy |
| 003 14 Nov 2023 | Buy Price: 26.58 | Profit: Open Day1 ($ 26.60) | Abandoned Baby | Buy |
| 004 08 Aug 2023 | Sell Price: 31.00 | Profit: Open Day1 ($ 30.82) | Abandoned Baby | Sell |
| 005 05 Jul 2023 | Sell Price: 26.25 | Profit: Open Day1 ($ 25.82) | Abandoned Baby | Sell |
| 006 08 Jun 2023 | Sell Price: 28.83 | Profit: Open Day1 ($ 28.74) | Abandoned Baby | Sell |
| 007One Year Average | Both Sides Result for 6 Signals |
Loss: $ -0.21 ($ -0.03 / Signal) |
All of Them | Buy + Sell |
| Simple Moving Averages (SMA) Period | Value $ | Signal | Exponential Moving Averages (EMA) Period | Value $ | Signal | |
|---|---|---|---|---|---|---|
| 2 | 36.68 | SELL | 2 | 36.56 | SELL | |
| 3 | 36.59 | SELL | 3 | 36.52 | SELL | |
| 5 | 36.36 | BUY | 5 | 36.39 | BUY | |
| 8 | 36.17 | BUY | 8 | 36.18 | BUY | |
| 13 | 35.71 | BUY | 13 | 35.86 | BUY | |
| 21 | 35.30 | BUY | 21 | 35.48 | BUY | |
| 34 | 34.82 | BUY | 34 | 35.04 | BUY | |
| 55 | 34.52 | BUY | 55 | 34.44 | BUY | |
| 90 | 33.56 | BUY | 90 | 33.55 | BUY | |
| 200 | 30.51 | BUY | 200 | 32.26 | BUY |
Citizens Financial Group
IPO: 2014-09-24
Ticker: CFGIndices: S&P 500,
Exchange: New York Stock Exchange, Inc. (US - USD)
Website: http://www.citizensbank.com
Phone:
Common Stock
Finance (
State Commercial Banks
 Click to Enlarge