| Date | Price $ | Result % | Candle Name | Side |
|---|---|---|---|---|
| 001 15 Apr 2024 | Buy Price: 34.62 | Loss: Close Day2 ($ 34.10) | Abandoned Baby | Buy |
| 002 18 Jan 2024 | Sell Price: 33.24 | Loss: Close Day2 ($ 34.56) | Engulfing | Sell |
| 003 02 Jan 2024 | Buy Price: 34.78 | Loss: Close Day2 ($ 34.42) | Engulfing | Buy |
| 004 27 Oct 2023 | Sell Price: 22.89 | Loss: Close Day2 ($ 23.71) | Engulfing | Sell |
| 005 02 Oct 2023 | Sell Price: 24.50 | Profit: Open Day1 ($ 24.31) | Engulfing | Sell |
| 006 08 Aug 2023 | Sell Price: 28.05 | Profit: Open Day1 ($ 27.84) | Abandoned Baby | Sell |
| 007 21 Jul 2023 | Sell Price: 28.26 | Profit: Close Day2 ($ 28.03) | Abandoned Baby | Sell |
| 008 21 Jul 2023 | Sell Price: 28.23 | Profit: Close Day2 ($ 28.03) | Engulfing | Sell |
| 009 05 Jun 2023 | Sell Price: 25.46 | Loss: Close Day2 ($ 27.12) | Engulfing | Sell |
| 010 05 Jun 2023 | Sell Price: 25.49 | Loss: Close Day2 ($ 27.12) | Dark Cloud Cover | Sell |
| 011One Year Average | Both Sides Result for 10 Signals |
Loss: $ -5.49 ($ -0.55 / Signal) |
All of Them | Buy + Sell |
| Simple Moving Averages (SMA) Period | Value $ | Signal | Exponential Moving Averages (EMA) Period | Value $ | Signal | |
|---|---|---|---|---|---|---|
| 2 | 37.03 | SELL | 2 | 36.91 | SELL | |
| 3 | 37.04 | SELL | 3 | 36.84 | SELL | |
| 5 | 36.78 | BUY | 5 | 36.56 | BUY | |
| 8 | 35.79 | BUY | 8 | 36.23 | BUY | |
| 13 | 35.50 | BUY | 13 | 35.96 | BUY | |
| 21 | 35.75 | BUY | 21 | 35.81 | BUY | |
| 34 | 35.91 | BUY | 34 | 35.62 | BUY | |
| 55 | 35.23 | BUY | 55 | 35.17 | BUY | |
| 90 | 34.96 | BUY | 90 | 34.19 | BUY | |
| 200 | 30.43 | BUY | 200 | 32.20 | BUY |
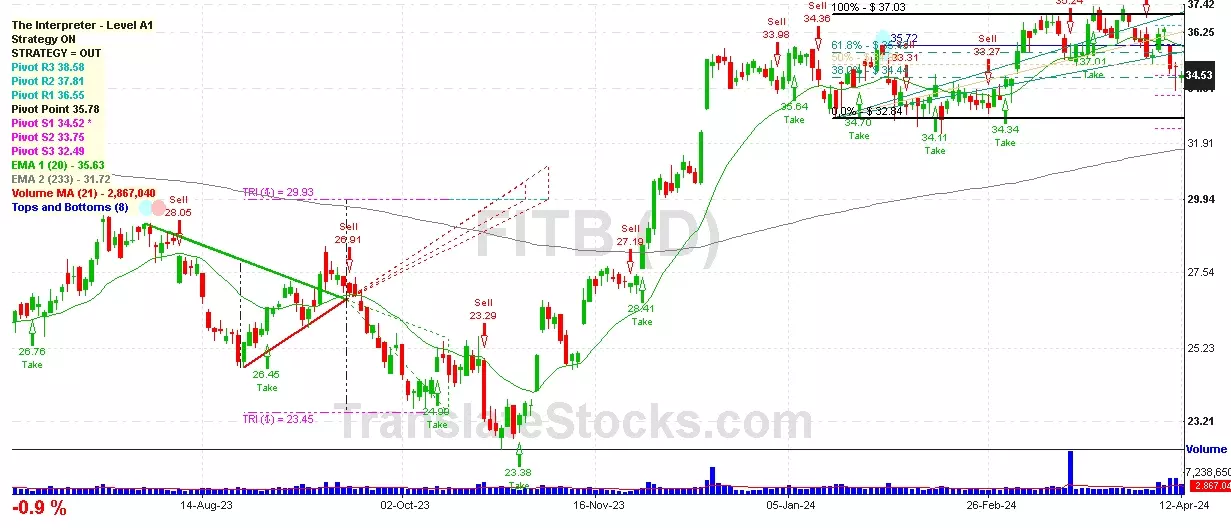
Fifth Third Bancorp
IPO: 2011-01-20
Ticker: FITBIndices: S&P 500,
Exchange: Nasdaq Nms - Global Market (US - USD)
Website: https://www.53.com/
Phone:
Common Stock
Finance (
State Commercial Banks

 Click to Enlarge