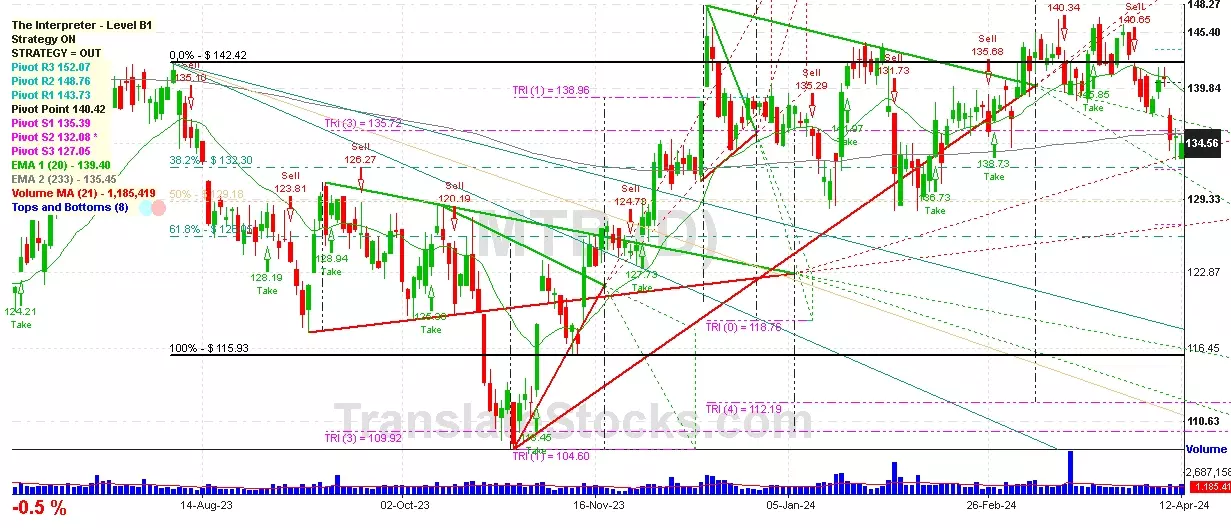
Hey Friend, I'm analysing M & T BANK CORP (MTB), and it is between the Support of $ 132.30 (38.2% of Fibonacci) and the Resistance of $ 135.39 (PivotS1). The stock is also approaching the line of PivotS1 at $ 135.39, and if it goes above this line it could reach the next Resistance of Triangle projection at $135.72.

| Date | Price $ | Result % | Candle Name | Side |
|---|---|---|---|---|
| 001 15 Apr 2024 | Buy Price: 140.94 | Loss: Close Day2 ($ 139.04) | Abandoned Baby | Buy |
| 002 10 Apr 2024 | Sell Price: 134.86 | Profit: Open Day2 ($ 133.08) | Abandoned Baby | Sell |
| 003 08 Mar 2024 | Sell Price: 142.74 | Profit: Open Day1 ($ 142.16) | Engulfing | Sell |
| 004 01 Mar 2024 | Sell Price: 136.91 | Loss: Close Day2 ($ 143.86) | Abandoned Baby | Sell |
| 005 26 Feb 2024 | Sell Price: 135.68 | Loss: Close Day2 ($ 138.13) | Abandoned Baby | Sell |
| 006 02 Jan 2024 | Buy Price: 139.03 | Loss: Close Day2 ($ 136.29) | Engulfing | Buy |
| 007 14 Nov 2023 | Buy Price: 123.30 | Profit: Open Day1 ($ 123.41) | Abandoned Baby | Buy |
| 008 30 Jun 2023 | Sell Price: 123.76 | Loss: Close Day2 ($ 125.52) | Dark Cloud Cover | Sell |
| 009 05 Jun 2023 | Sell Price: 122.09 | Loss: Close Day2 ($ 129.97) | Engulfing | Sell |
| 010One Year Average | Both Sides Result for 9 Signals |
Loss: $ -21.21 ($ -2.36 / Signal) |
All of Them | Buy + Sell |
| Simple Moving Averages (SMA) Period | Value $ | Signal | Exponential Moving Averages (EMA) Period | Value $ | Signal | |
|---|---|---|---|---|---|---|
| 2 | 146.64 | SELL | 2 | 146.60 | SELL | |
| 3 | 147.08 | SELL | 3 | 146.55 | SELL | |
| 5 | 146.76 | SELL | 5 | 145.91 | BUY | |
| 8 | 144.44 | BUY | 8 | 144.74 | BUY | |
| 13 | 141.42 | BUY | 13 | 143.43 | BUY | |
| 21 | 141.19 | BUY | 21 | 142.39 | BUY | |
| 34 | 141.62 | BUY | 34 | 141.49 | BUY | |
| 55 | 140.24 | BUY | 55 | 140.27 | BUY | |
| 90 | 138.96 | BUY | 90 | 138.30 | BUY | |
| 200 | 132.52 | BUY | 200 | 135.93 | BUY |
M & T Bank Corp
IPO: 1998-06-01
Ticker: MTBIndices: S&P 500,
Exchange: New York Stock Exchange, Inc. (US - USD)
Website: https://www.mtb.com
Phone:
Common Stock
Finance (
State Commercial Banks
 Click to Enlarge