| Date | Price $ | Result % | Candle Name | Side |
|---|---|---|---|---|
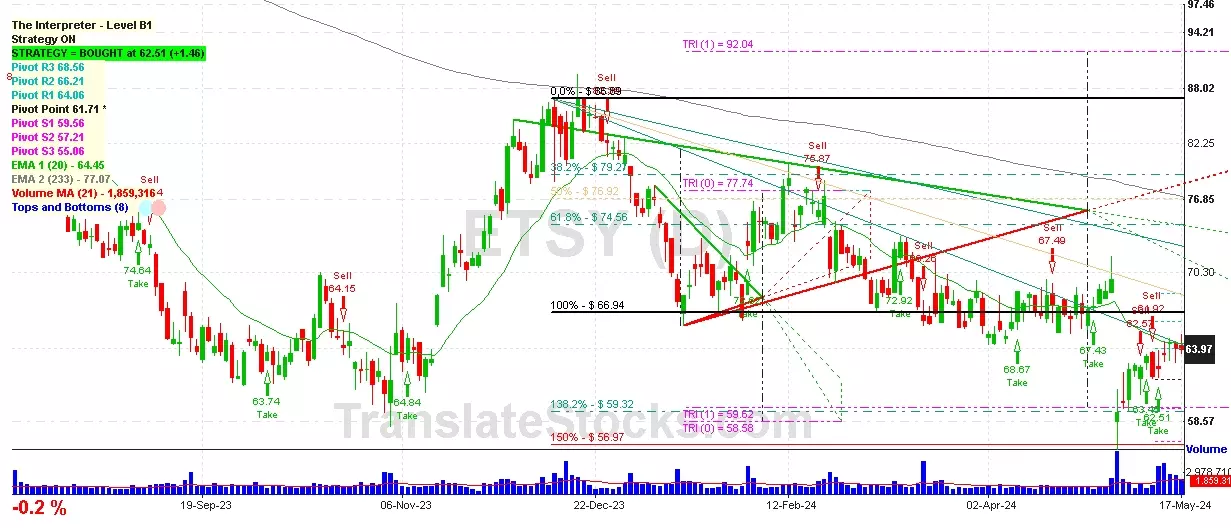
| 001 25 Apr 2024 | Buy Price: 67.20 | Profit: Open Day1 ($ 67.35) | Piercing Line | Buy |
| 002 01 Apr 2024 | Sell Price: 65.90 | Profit: Open Day1 ($ 64.90) | Abandoned Baby | Sell |
| 003 13 Feb 2024 | Sell Price: 74.39 | Loss: Close Day2 ($ 77.76) | Abandoned Baby | Sell |
| 004 02 Nov 2023 | Buy Price: 61.63 | Profit: Open Day1 ($ 63.62) | Engulfing | Buy |
| 005 02 Nov 2023 | Buy Price: 61.61 | Profit: Open Day1 ($ 63.62) | Piercing Line | Buy |
| 006 30 Oct 2023 | Sell Price: 61.31 | Profit: Close Day2 ($ 60.66) | Engulfing | Sell |
| 007 24 Oct 2023 | Buy Price: 64.59 | Loss: Close Day2 ($ 62.37) | Abandoned Baby | Buy |
| 008One Year Average | Both Sides Result for 7 Signals |
Profit: $ 0.21 ($ 0.03 / Signal) |
All of Them | Buy + Sell |
| Simple Moving Averages (SMA) Period | Value $ | Signal | Exponential Moving Averages (EMA) Period | Value $ | Signal | |
|---|---|---|---|---|---|---|
| 2 | 64.03 | SELL | 2 | 64.01 | SELL | |
| 3 | 64.21 | SELL | 3 | 63.96 | BUY | |
| 5 | 63.74 | BUY | 5 | 63.78 | BUY | |
| 8 | 63.33 | BUY | 8 | 63.70 | BUY | |
| 13 | 63.14 | BUY | 13 | 63.94 | BUY | |
| 21 | 64.83 | SELL | 21 | 64.53 | SELL | |
| 34 | 65.59 | SELL | 34 | 65.45 | SELL | |
| 55 | 66.63 | SELL | 55 | 66.77 | SELL | |
| 90 | 68.96 | SELL | 90 | 68.51 | SELL | |
| 200 | 70.52 | SELL | 200 | 74.43 | SELL |
Etsy Inc
IPO: 2015-04-16
Ticker: ETSYIndices: S&P 500,
Exchange: Nasdaq Nms - Global Market (US - USD)
Website: https://www.etsy.com/
Phone:
Common Stock
Trade & Services (
Services-business Services, Nec
Year | 2020 | 2019 | 2018 | 2017 | 2016 | 2015 | 2014 | 2013 | 2012 | |
|---|---|---|---|---|---|---|---|---|---|---|
| 1 | Assets + | 2,404 | 1,542 | 902 | 606 | 581 | 553 | 246 | 42 | 35 |
| 2 | Cash and Cash Equivalents + | 1,244 | 443 | 367 | 315 | 182 | 271 | 70 | 37 | 35 |
| 3 | Property + | 0 | 0 | 120 | 118 | 126 | 105 | 76 | 24 | 0 |
| 4 | Property + | 0 | 0 | 206 | 184 | 173 | 143 | 106 | 24 | 0 |
| 5 | Intangible Assets + | 187 | 199 | 35 | 4 | 8 | 3 | 5 | 0 | 0 |
| 6 | Finite-Lived Intangible Assets + | 187 | 199 | 35 | 4 | 8 | 3 | 5 | 0 | 0 |
| 7 | Liabilities and Equity + | 2,404 | 1,542 | 902 | 606 | 581 | 553 | 246 | 4 | -1 |
| 8 | Liabilities + | 1,662 | 1,136 | 501 | 209 | 236 | 223 | 99 | 0 | 0 |
| 9 | Temporary Equity + | 0 | 0 | 0 | 0 | 0 | 0 | 80 | 0 | 0 |
| 10 | Temporary Equity + | 0 | 0 | 0 | 0 | 0 | 0 | 80 | 0 | 0 |
| 11 | Stockholders' Equity + | 742 | 407 | 401 | 397 | 345 | 330 | 67 | 4 | -1 |
| 12 | Stockholders' Equity Attributable to Parent + | 742 | 407 | 401 | 397 | 345 | 330 | 67 | 4 | -1 |
| 13 | Preferred Stock + | 0 | 0 | 0 | 0 | 0 | 0 | 0 | 0 | 0 |
| 14 | Common Stock + | 0 | 0 | 0 | 0 | 0 | 0 | 0 | 0 | 0 |
| 15 | Partners' Capital + | -147 | -227 | -153 | -96 | -116 | -86 | -32 | 0 | 0 |
| 16 | Partners' Capital + | -147 | -227 | -153 | -96 | -116 | -86 | -32 | 0 | 0 |
| 17 | Limited Liability Company (LLC) Members' Equity + | -141 | -236 | -161 | -102 | -98 | -75 | -36 | 0 | 0 |
| 18 | Limited Liability Company (LLC) Members' Equity + | -141 | -236 | -161 | -102 | -98 | -75 | -36 | 0 | 0 |
| 19 | Current Assets + | 1,895 | 921 | 680 | 439 | 371 | 359 | 127 | 0 | 0 |
| 20 | Cash + | 425 | 374 | 624 | 341 | 100 | 22 | 19 | 0 | 0 |
| 21 | Current Other Undisclosed Receivables | 0 | 0 | 44 | 64 | 0 | 0 | 0 | 0 | 0 |
| 22 | Current Receivables + | 23 | 15 | 56 | 98 | 26 | 20 | 15 | 0 | 0 |
| 23 | Current Deferred Costs + | 0 | 0 | 0 | 0 | 17 | 17 | 0 | 0 | 0 |
| 24 | Long-Term Assets + | 235 | 267 | 61 | 40 | 37 | 30 | 33 | 5 | 0 |
| 25 | Long-term Investments and Receivables + | 39 | 89 | 0 | 0 | 0 | 0 | 0 | 0 | 0 |
| 26 | Long-Term Restricted Cash and Investments + | 5 | 5 | 5 | 5 | 5 | 5 | 5 | 0 | 0 |
| 27 | Current Liabilities + | 455 | 189 | 112 | 102 | 84 | 80 | 41 | 0 | 0 |
| 28 | Long-Term Other Undisclosed Liabilities | 1,045 | 763 | 339 | 65 | 127 | 121 | 56 | 0 | 0 |
| 29 | Long-Term Liabilities + | 1,207 | 947 | 389 | 107 | 152 | 143 | 58 | 0 | 0 |
| 30 | Total Current Assets + | 1,895 | 921 | 680 | 439 | 371 | 359 | 127 | 0 | 0 |
| 31 | Operating Lease + | 20 | 24 | 0 | 0 | 0 | 0 | 0 | 0 | 0 |
| 32 | Finance Lease + | 70 | 84 | 0 | 0 | 0 | 0 | 0 | 0 | 0 |
| 33 | Goodwill + | 141 | 139 | 37 | 39 | 36 | 28 | 31 | 5 | 0 |
| 34 | Long-Term Other Assets + | 24 | 30 | 1 | 1 | 1 | 2 | 2 | 0 | 0 |
| 35 | Long-Term Regulated Entity + | 0 | 0 | 7 | 0 | 0 | 0 | 0 | 0 | 0 |
| 36 | Long-Term Deferred Costs + | 0 | 0 | 0 | 0 | 34 | 51 | 0 | 0 | 0 |
| 37 | Deferred Income Tax Assets + | 24 | 44 | 23 | 1 | 0 | 0 | 0 | 0 | 0 |
| 38 | Total Assets + | 2,404 | 1,542 | 902 | 606 | 581 | 553 | 246 | 0 | 0 |
| 39 | Total Liabilities + | 1,662 | 1,136 | 501 | 209 | 236 | 223 | 99 | 0 | 0 |
| 40 | Total Liabilities and Equity + | 2,404 | 1,542 | 902 | 606 | 581 | 553 | 246 | 0 | 0 |
Year | 2020 | 2019 | 2018 | 2017 | 2016 | 2015 | 2014 | 2013 | |
|---|---|---|---|---|---|---|---|---|---|
| 1 | 0 | 0 | 0 | 441 | 365 | 273 | 196 | 125 | |
| 2 | 0 | 0 | 0 | -151 | -123 | -97 | -74 | -48 | |
| 3 | -465 | -271 | -191 | -151 | -123 | 0 | 0 | 0 | |
| 4 | 1,261 | 547 | 413 | 290 | 242 | 177 | 122 | 77 | |
| 5 | 180 | 122 | 97 | 75 | 55 | 43 | 37 | 28 | |
| 6 | 501 | 216 | 158 | 109 | 82 | 0 | 0 | 0 | |
| 7 | 0 | 5 | 0 | 0 | 0 | 0 | 0 | 0 | |
| 8 | 156 | 121 | 83 | 91 | 86 | 69 | 52 | 31 | |
| 9 | 15 | 11 | 4 | 2 | 2 | 2 | 2 | 1 | |
| 10 | -1 | 2 | 0 | 1 | 1 | 1 | 0 | 1 | |
| 11 | -837 | -459 | -338 | -278 | -224 | -178 | -128 | -77 | |
| 12 | 424 | 89 | 75 | 12 | 18 | -2 | -6 | 1 | |
| 13 | 7 | 13 | 9 | 2 | 2 | 0 | 0 | 0 | |
| 14 | -7 | 3 | -6 | 29 | -15 | -22 | -3 | 0 | |
| 15 | -58 | -8 | -20 | 20 | -20 | -26 | -4 | -1 | |
| 16 | 0 | 0 | 0 | 11 | 7 | 2 | 1 | 0 | |
| 17 | 3 | 3 | 0 | 0 | 0 | 0 | 0 | 0 | |
| 18 | 42 | 24 | 22 | 11 | 7 | 0 | 0 | 0 | |
| 19 | 17 | 0 | 0 | 0 | 0 | 0 | 0 | 0 | |
| 20 | 366 | 81 | 55 | 32 | -3 | -28 | -10 | 0 | |
| 21 | -16 | 15 | 22 | 50 | -27 | -26 | -5 | -1 | |
| 22 | Total Net Income (Loss) Attributable to Parent + | 349 | 96 | 77 | 82 | -30 | -54 | -15 | -1 |
| 23 | 0 | 0 | 0 | 0 | 0 | 0 | 0 | 0 | |
| 24 | 349 | 96 | 77 | 82 | -30 | -54 | 0 | 0 | |
| 25 | Total Earnings Per Share + | 2.88 | 0.80 | 0.64 | 0.69 | -0.26 | -0.59 | 0 | 0 |
| 26 | Total Earnings Per Share + | 2.69 | 0.76 | 0.61 | 0.68 | -0.26 | -0.59 | 0 | 0 |
| 27 | Total Earnings Per Share + | 0 | 0 | 0 | 0 | -0.26 | -0.59 | -0.38 | -0.02 |

 Click to Enlarge