| Date | Price $ | Result % | Candle Name | Side |
|---|---|---|---|---|
| 001 20 Sep 2023 | Sell Price: 128.00 | Profit: Open Day1 ($ 126.96) | Dark Cloud Cover | Sell |
| 002 03 Aug 2023 | Buy Price: 124.41 | Profit: Open Day1 ($ 124.89) | Engulfing | Buy |
| 003 05 Jul 2023 | Sell Price: 114.54 | Profit: Open Day1 ($ 112.47) | Abandoned Baby | Sell |
| 004 08 Jun 2023 | Sell Price: 115.64 | Profit: Open Day1 ($ 114.08) | Engulfing | Sell |
| 005One Year Average | Both Sides Result for 4 Signals |
Profit: $ 5.15 ($ 1.29 / Signal) |
All of Them | Buy + Sell |
| Simple Moving Averages (SMA) Period | Value $ | Signal | Exponential Moving Averages (EMA) Period | Value $ | Signal | |
|---|---|---|---|---|---|---|
| 2 | 154.66 | SELL | 2 | 154.43 | SELL | |
| 3 | 155.12 | SELL | 3 | 154.66 | SELL | |
| 5 | 154.95 | SELL | 5 | 154.95 | SELL | |
| 8 | 154.85 | SELL | 8 | 155.61 | SELL | |
| 13 | 156.72 | SELL | 13 | 156.93 | SELL | |
| 21 | 160.99 | SELL | 21 | 158.19 | SELL | |
| 34 | 161.30 | SELL | 34 | 158.31 | SELL | |
| 55 | 157.22 | SELL | 55 | 156.57 | SELL | |
| 90 | 154.14 | SELL | 90 | 152.43 | BUY | |
| 200 | 137.97 | BUY | 200 | 141.51 | BUY |
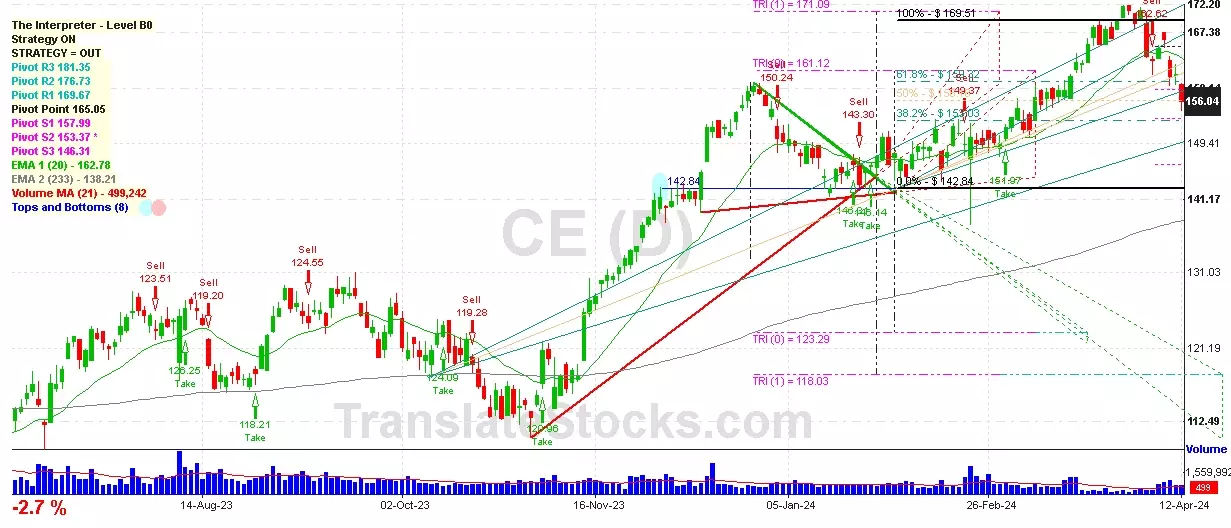
Celanese Corp
IPO: 2005-01-21
Ticker: CEIndices: S&P 500,
Exchange: New York Stock Exchange, Inc. (US - USD)
Website: https://www.celanese.com/
Phone:
Common Stock
Life Sciences (
Plastic Material, Synth Resin/rubber, Cellulos (no Glass)
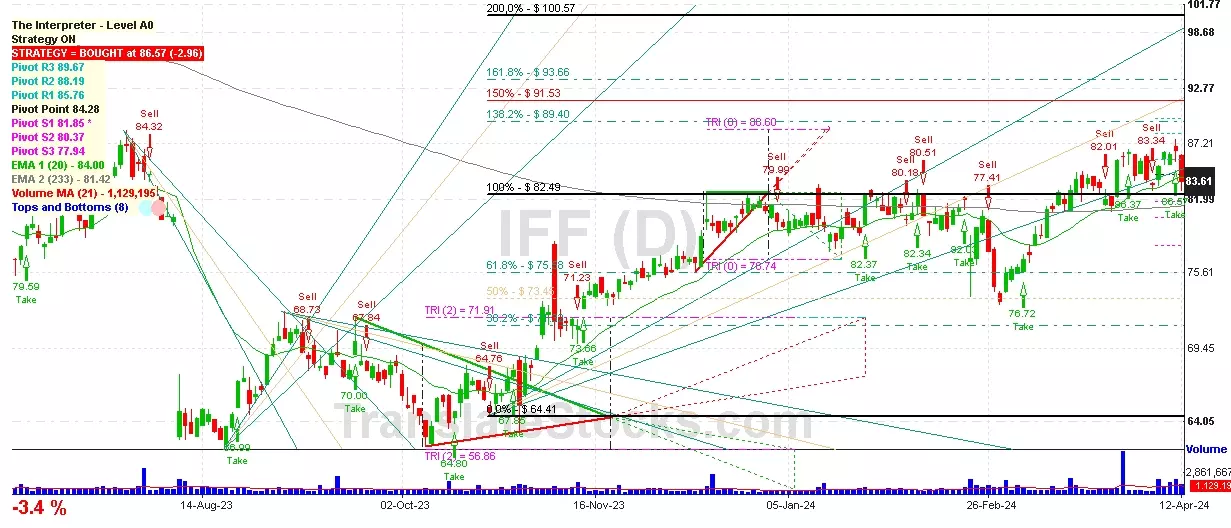
 Click to Enlarge
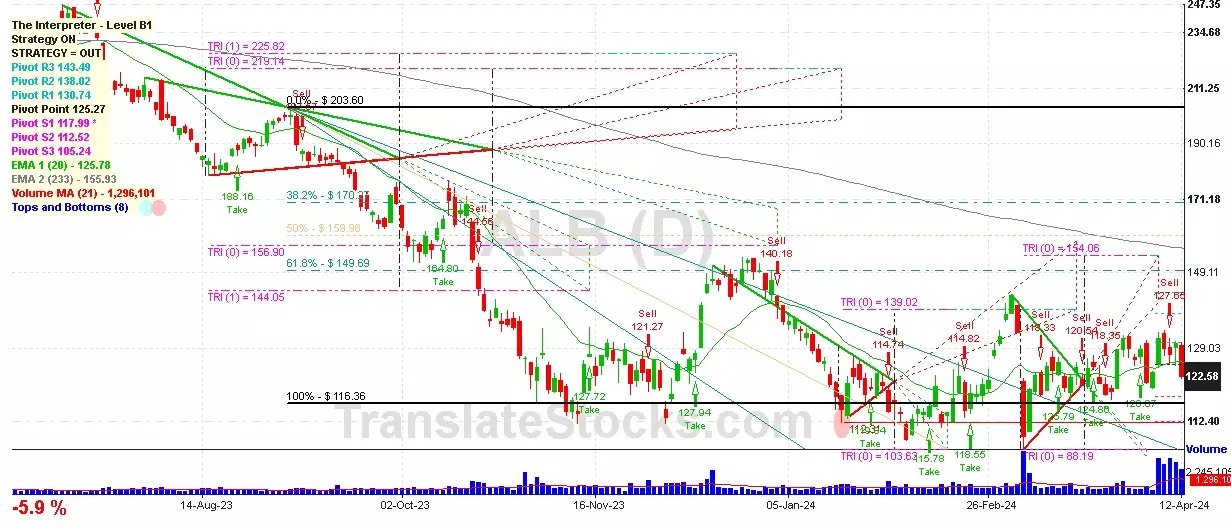