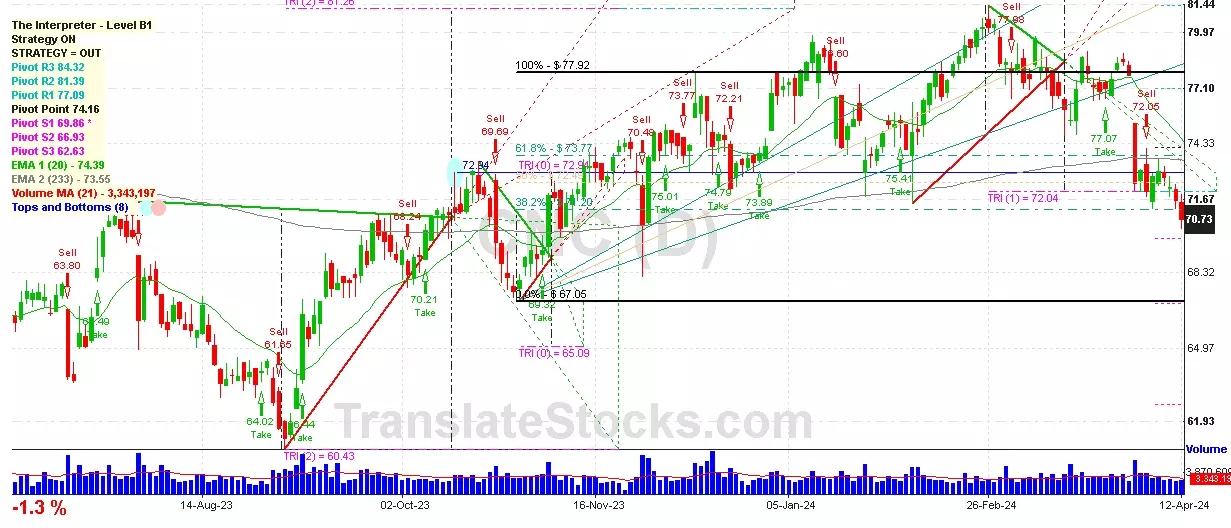
Hey Friend, I'm analysing CENTENE CORP (CNC), and it is between the Support of $ 69.86 (PivotS1) and the Resistance of $ 71.20 (38.2% of Fibonacci). The stock is also approaching the line of PivotS1 at $ 69.86, and if it goes below this line it could reach the next Support of 0% of Fibonacci at $ 67.05.

| Date | Price $ | Result % | Candle Name | Side |
|---|---|---|---|---|
| 001 01 Apr 2024 | Sell Price: 77.75 | Profit: Open Day1 ($ 75.33) | Abandoned Baby | Sell |
| 002 05 Feb 2024 | Sell Price: 74.07 | Profit: Open Day1 ($ 73.76) | Abandoned Baby | Sell |
| 003 16 Nov 2023 | Sell Price: 72.94 | Profit: Close Day1 ($ 72.61) | Engulfing | Sell |
| 004 16 Nov 2023 | Sell Price: 73.21 | Profit: Close Day1 ($ 72.61) | Dark Cloud Cover | Sell |
| 005 19 Oct 2023 | Sell Price: 71.94 | Profit: Close Day1 ($ 71.89) | Abandoned Baby | Sell |
| 006 02 Oct 2023 | Buy Price: 69.30 | Loss: Close Day2 ($ 68.25) | Engulfing | Buy |
| 007 14 Sep 2023 | Sell Price: 67.61 | Profit: Open Day1 ($ 67.56) | Dark Cloud Cover | Sell |
| 008 22 Aug 2023 | Sell Price: 63.80 | Profit: Close Day1 ($ 63.63) | Abandoned Baby | Sell |
| 009 10 Jul 2023 | Buy Price: 67.31 | Profit: Close Day1 ($ 67.76) | Abandoned Baby | Buy |
| 010 23 Jun 2023 | Sell Price: 66.33 | Profit: Open Day1 ($ 66.30) | Abandoned Baby | Sell |
| 011 23 Jun 2023 | Sell Price: 66.37 | Profit: Open Day1 ($ 66.30) | Engulfing | Sell |
| 012 14 Jun 2023 | Sell Price: 64.65 | Loss: Close Day2 ($ 65.67) | Abandoned Baby | Sell |
| 013 31 May 2023 | Buy Price: 62.41 | Profit: Open Day1 ($ 62.69) | Engulfing | Buy |
| 014 11 May 2023 | Buy Price: 67.37 | Profit: Open Day1 ($ 67.58) | Piercing Line | Buy |
| 015One Year Average | Both Sides Result for 14 Signals |
Profit: $ 2.90 ($ 0.21 / Signal) |
All of Them | Buy + Sell |
| Simple Moving Averages (SMA) Period | Value $ | Signal | Exponential Moving Averages (EMA) Period | Value $ | Signal | |
|---|---|---|---|---|---|---|
| 2 | 74.84 | SELL | 2 | 74.60 | SELL | |
| 3 | 75.29 | SELL | 3 | 74.86 | SELL | |
| 5 | 75.46 | SELL | 5 | 74.92 | SELL | |
| 8 | 74.77 | SELL | 8 | 74.69 | SELL | |
| 13 | 73.68 | BUY | 13 | 74.46 | SELL | |
| 21 | 73.81 | BUY | 21 | 74.55 | SELL | |
| 34 | 75.11 | SELL | 34 | 74.95 | SELL | |
| 55 | 76.40 | SELL | 55 | 75.28 | SELL | |
| 90 | 76.05 | SELL | 90 | 75.06 | SELL | |
| 200 | 72.25 | BUY | 200 | 73.79 | BUY |
Centene Corp
IPO: 2001-12-13
Ticker: CNCIndices: S&P 500,
Exchange: New York Stock Exchange, Inc. (US - USD)
Website: https://www.centene.com/
Phone:
Common Stock
Finance (
Hospital & Medical Service Plans
Year | 2020 | 2019 | 2018 | 2017 | 2016 | 2015 | 2014 | 2013 | 2012 | 2011 | 2010 | 2009 | 2008 | 2007 | |
|---|---|---|---|---|---|---|---|---|---|---|---|---|---|---|---|
| 1 | Assets + | 68,719 | 40,994 | 30,901 | 21,855 | 20,197 | 7,339 | 5,838 | 3,529 | 2,742 | 2,190 | 1,944 | 1,702 | 379 | 269 |
| 2 | Investments in and Advance to Affiliates + | 838 | 664 | 387 | 0 | 0 | 0 | 0 | 0 | 0 | 0 | 0 | 0 | 0 | 0 |
| 3 | Cash and Cash Equivalents + | 10,800 | 12,123 | 5,342 | 4,072 | 3,930 | 1,760 | 1,546 | 974 | 844 | 574 | 434 | 404 | 379 | 269 |
| 4 | Property + | 2,774 | 2,121 | 1,706 | 1,104 | 797 | 518 | 445 | 395 | 378 | 350 | 326 | 230 | 0 | 0 |
| 5 | Property + | 4,251 | 3,223 | 2,506 | 1,694 | 1,239 | 869 | 733 | 640 | 581 | 527 | 465 | 0 | 0 | 0 |
| 6 | Intangible Assets + | 8,388 | 2,063 | 2,239 | 1,398 | 1,545 | 155 | 120 | 49 | 20 | 27 | 29 | 22 | 0 | 0 |
| 7 | Finite-Lived Intangible Assets + | 8,388 | 2,063 | 2,239 | 1,398 | 1,545 | 155 | 120 | 49 | 20 | 27 | 29 | 0 | 0 | 0 |
| 8 | Liabilities and Equity + | 68,719 | 40,994 | 30,901 | 21,855 | 20,197 | 7,339 | 5,838 | 3,529 | 2,742 | 2,190 | 1,944 | 1,702 | 501 | 415 |
| 9 | Liabilities + | 42,757 | 28,302 | 19,878 | 14,979 | 14,143 | 5,015 | 3,947 | 2,286 | 1,788 | 1,254 | 1,147 | 1,083 | 0 | 0 |
| 10 | Debt and Lease Obligation + | 0 | 0 | 0 | 0 | 0 | 0 | 0 | 0 | 0 | 0 | 95 | 0 | 0 | 0 |
| 11 | Temporary Equity + | 77 | 33 | 10 | 12 | 145 | 156 | 148 | 0 | 0 | 0 | 0 | 0 | 0 | 0 |
| 12 | Redeemable Noncontrolling Interest + | 77 | 33 | 10 | 12 | 145 | 156 | 148 | 0 | 0 | 0 | 0 | 0 | 0 | 0 |
| 13 | Stockholders' Equity + | 25,885 | 12,659 | 11,013 | 6,864 | 5,909 | 2,168 | 1,743 | 1,243 | 954 | 936 | 797 | 619 | 501 | 415 |
| 14 | Stockholders' Equity Attributable to Parent + | 25,773 | 12,551 | 10,917 | 6,850 | 5,895 | 2,157 | 1,744 | 1,234 | 953 | 936 | 794 | 601 | 0 | 0 |
| 15 | Preferred Stock + | 0 | 0 | 0 | 0 | 0 | 0 | 0 | 0 | 0 | 0 | 0 | 0 | 0 | 0 |
| 16 | Common Stock + | 0 | 0 | 0 | 0 | 0 | 0 | 0 | 0 | 0 | 0 | 0 | 0 | 0 | 0 |
| 17 | Partners' Capital + | 6,792 | 4,984 | 3,663 | 2,748 | 1,920 | 1,358 | 1,003 | 732 | 567 | 565 | 454 | 359 | 0 | 0 |
| 18 | Partners' Capital + | 6,792 | 4,984 | 3,663 | 2,748 | 1,920 | 1,358 | 1,003 | 732 | 567 | 565 | 454 | 359 | 0 | 0 |
| 19 | Limited Liability Company (LLC) Members' Equity + | 7,129 | 5,118 | 3,607 | 2,745 | 1,884 | 1,348 | 1,002 | 729 | 567 | 565 | 454 | 359 | 0 | 0 |
| 20 | Limited Liability Company (LLC) Members' Equity + | 7,129 | 5,118 | 3,607 | 2,745 | 1,884 | 1,348 | 1,002 | 729 | 567 | 565 | 454 | 359 | 0 | 0 |
| 21 | Current Assets + | 23,393 | 20,323 | 11,998 | 8,703 | 8,365 | 3,605 | 3,034 | 1,800 | 1,374 | 940 | 657 | 616 | 0 | 0 |
| 22 | Cash + | 1,580 | 863 | 722 | 531 | 505 | 176 | 177 | 102 | 139 | 130 | 21 | 40 | 0 | 0 |
| 23 | Current Disposal Group + | 0 | 0 | 0 | 0 | 0 | 0 | 75 | 78 | 177 | 0 | 1 | 5 | 0 | 0 |
| 24 | Long-Term Assets + | 21,562 | 8,773 | 7,542 | 5,203 | 4,807 | 1,019 | 834 | 407 | 320 | 340 | 308 | 262 | 0 | 0 |
| 25 | Long-term Investments and Receivables + | 12,853 | 7,717 | 6,861 | 5,312 | 4,545 | 1,927 | 1,280 | 792 | 615 | 506 | 596 | 525 | 0 | 0 |
| 26 | Long-Term Restricted Cash and Investments + | 1,060 | 658 | 555 | 135 | 138 | 115 | 100 | 47 | 35 | 27 | 23 | 20 | 0 | 0 |
| 27 | Long-Term Disposal Group + | 0 | 0 | 0 | 0 | 0 | 0 | 0 | 0 | 2 | 0 | 0 | 0 | 0 | 0 |
| 28 | Current Liabilities + | 21,585 | 12,932 | 11,971 | 9,332 | 8,623 | 3,629 | 2,900 | 1,559 | 1,197 | 838 | 765 | 716 | 0 | 0 |
| 29 | Long-Term Other Undisclosed Liabilities | -1,334 | -811 | 0 | 0 | 0 | 0 | 0 | 0 | 1 | 0 | 0 | 0 | 0 | 0 |
| 30 | Long-Term Liabilities + | 21,172 | 15,370 | 7,907 | 5,647 | 5,520 | 1,386 | 1,047 | 727 | 591 | 416 | 381 | 367 | 0 | 0 |
| 31 | Increase (Decrease) in Stockholders' Equity [Roll Forward] + | -816 | -214 | -139 | -244 | -179 | -147 | -98 | -90 | -70 | -57 | -50 | -47 | 0 | 0 |
| 32 | Treasury Stock Transactions + | -816 | -214 | -139 | -244 | -179 | -147 | -98 | -90 | -70 | -57 | -50 | -47 | 0 | 0 |
| 33 | Treasury Stock + | -816 | -214 | -139 | -244 | -179 | -147 | -98 | -90 | -70 | -57 | -50 | -47 | 0 | 0 |
| 34 | Current Other Assets + | 1,317 | 1,090 | 784 | 687 | 832 | 390 | 324 | 218 | 127 | 78 | 64 | 65 | 0 | 0 |
| 35 | Total Current Assets + | 23,393 | 20,323 | 11,998 | 8,703 | 8,365 | 3,605 | 3,034 | 1,800 | 1,374 | 940 | 657 | 616 | 0 | 0 |
| 36 | Operating Lease + | 1,311 | 661 | 0 | 0 | 0 | 0 | 0 | 0 | 0 | 0 | 0 | 0 | 0 | 0 |
| 37 | Goodwill + | 18,652 | 6,863 | 7,015 | 4,749 | 4,712 | 842 | 754 | 348 | 256 | 282 | 278 | 225 | 0 | 0 |
| 38 | Long-Term Other Assets + | 1,599 | 1,249 | 527 | 454 | 95 | 177 | 80 | 59 | 64 | 58 | 30 | 37 | 0 | 0 |
| 39 | Long-Term Regulated Entity + | 157 | 143 | 75 | 65 | 77 | 14 | 14 | 0 | 0 | 0 | 0 | 0 | 0 | 0 |
| 40 | Total Assets + | 68,719 | 40,994 | 30,901 | 21,855 | 20,197 | 7,339 | 5,838 | 3,529 | 2,742 | 2,190 | 1,944 | 1,702 | 0 | 0 |
| 41 | Total Liabilities + | 42,757 | 28,302 | 19,878 | 14,979 | 14,143 | 5,015 | 3,947 | 2,286 | 1,788 | 1,254 | 1,147 | 1,083 | 0 | 0 |
| 42 | Stockholders' Equity Attributable to Noncontrolling Interest + | 112 | 108 | 96 | 14 | 14 | 11 | -1 | 9 | 1 | 1 | 3 | 19 | 0 | 0 |
| 43 | Total Stockholders' Equity + | 25,885 | 12,659 | 11,013 | 6,864 | 5,909 | 2,168 | 1,743 | 1,243 | 954 | 936 | 797 | 619 | 501 | 415 |
| 44 | Total Liabilities and Equity + | 68,719 | 40,994 | 30,901 | 21,855 | 20,197 | 7,339 | 5,838 | 3,529 | 2,742 | 2,190 | 1,944 | 1,702 | 0 | 0 |
Year | 2020 | 2019 | 2018 | 2017 | 2016 | 2015 | 2014 | 2013 | 2012 | 2011 | 2010 | 2009 | 2008 | |
|---|---|---|---|---|---|---|---|---|---|---|---|---|---|---|
| 1 | 0 | 0 | 0 | 43,353 | 35,399 | 19,389 | 14,198 | 10,153 | 8,126 | 5,077 | 4,192 | 3,787 | 0 | |
| 2 | 111,115 | 74,639 | 60,116 | 48,382 | 40,607 | 22,760 | 16,560 | 10,863 | 8,668 | 5,341 | 4,448 | 4,103 | 3,365 | |
| 3 | -3,303 | -2,465 | -2,386 | -1,847 | -1,864 | 0 | 0 | 0 | 0 | 0 | 0 | 0 | 0 | |
| 4 | 1,259 | 643 | 495 | 361 | 278 | 111 | 89 | 67 | 66 | 58 | 52 | 44 | 35 | |
| 5 | 341 | 203 | 0 | 0 | 0 | 0 | 0 | 0 | 0 | 0 | 0 | 0 | 0 | |
| 6 | 0 | 0 | 0 | 0 | 0 | 1,826 | 1,314 | 931 | 705 | 587 | 548 | 515 | 445 | |
| 7 | 9,867 | 6,533 | 6,043 | 4,446 | 3,676 | 1,802 | 1,298 | 0 | 0 | 0 | 0 | 0 | 0 | |
| 8 | 104 | 0 | 0 | 0 | 0 | 0 | 0 | 0 | 0 | 0 | 0 | 0 | 0 | |
| 9 | 0 | 0 | 0 | 0 | 0 | 0 | 0 | 0 | 0 | 0 | -8 | 0 | 0 | |
| 10 | 3,082 | 1,781 | 1,458 | 1,199 | 1,260 | 705 | 464 | 277 | -27 | 190 | 157 | 138 | 132 | |
| 11 | 0 | 0 | 0 | 0 | 0 | 0 | 0 | 0 | 11 | 10 | 11 | 7 | 0 | |
| 12 | 480 | 443 | 253 | 190 | 114 | 35 | 28 | 18 | 36 | 13 | 15 | 16 | 22 | |
| 13 | 728 | 412 | 343 | 255 | 217 | 43 | 35 | 27 | 20 | 20 | 18 | 16 | 17 | |
| 14 | 57 | 30 | 0 | 0 | 0 | 0 | 0 | 0 | 0 | 8 | 0 | 0 | 0 | |
| 15 | 2,773 | 1,782 | 1,368 | 1,134 | 1,157 | 697 | 457 | 269 | -12 | 175 | 154 | 138 | 137 | |
| 16 | 0 | 0 | 0 | 3 | 5 | 8 | 6 | 0 | 0 | 0 | 0 | 0 | 0 | |
| 17 | -979 | -473 | -474 | -326 | -599 | -339 | -196 | -107 | 0 | -67 | -60 | -49 | -52 | |
| 18 | 0 | 0 | 0 | 482 | -41 | 19 | 65 | 55 | -11 | 41 | 34 | 40 | 32 | |
| 19 | 0 | 0 | 0 | 0 | 0 | 0 | 4 | 6 | -134 | -13 | 0 | 0 | 0 | |
| 20 | 0 | 0 | 0 | 0 | -2 | 1 | 3 | 4 | -86 | -9 | -4 | 1 | 0 | |
| 21 | 0 | 0 | 0 | 0 | 0 | 0 | 3 | 4 | -87 | -9 | 4 | -2 | -1 | |
| 22 | 1,794 | 1,309 | 894 | 808 | 561 | 357 | 264 | 166 | -11 | 108 | 98 | 86 | 83 | |
| 23 | 0 | 0 | 0 | 20 | -2 | 2 | 0 | 0 | 0 | 0 | 0 | 0 | 0 | |
| 24 | 14 | 12 | 6 | 20 | 1 | -2 | 7 | -1 | 13 | 3 | 3 | 3 | 0 | |
| 25 | Total Net Income (Loss) Attributable to Parent + | 1,808 | 1,321 | 900 | 828 | 562 | 355 | 271 | 165 | 2 | 111 | 95 | 84 | 83 |
| 26 | Income (Loss) from Continuing Operations + | 0 | 0 | 0 | 808 | 558 | 358 | 261 | 162 | -11 | 108 | 94 | 89 | 84 |
| 27 | Total Income (Loss) from Continuing Operations + | 0 | 0 | 0 | 1,636 | 1,117 | 714 | 529 | 323 | -9 | 219 | 185 | 175 | 168 |
| 28 | Income (Loss) from Discontinued Operations + | 0 | 0 | 0 | 0 | 0 | 0 | 3 | 4 | -87 | -9 | 4 | -2 | -1 |
| 29 | Total Income (Loss) from Discontinued Operations + | 0 | 0 | 0 | 0 | 3 | -1 | 3 | 4 | -87 | -9 | 4 | -2 | -1 |
| 30 | Income (Loss) from Continuing Operations + | 0 | 0 | 0 | 4.80 | 3.50 | 2.99 | 2.30 | 2.98 | 0.04 | 2.22 | 1.87 | 2 | 1.95 |
| 31 | 0 | 0 | 0 | 0 | 0.02 | -0.01 | 0.03 | 0.07 | -1.68 | -0.18 | 0.08 | -0.06 | -0.02 | |
| 32 | Total Earnings Per Share + | 3.17 | 3.19 | 2.31 | 4.80 | 3.52 | 2.98 | 2.33 | 3.05 | 0.04 | 2.22 | 1.95 | 1.94 | 1.93 |
| 33 | Income (Loss) from Continuing Operations + | 0 | 0 | 0 | 4.80 | 3.50 | 2.99 | 2.30 | 2.98 | 0.04 | 2.22 | 1.87 | 2 | 1.95 |
| 34 | Income (Loss) from Continuing Operations + | 0 | 0 | 0 | 4.69 | 3.41 | 2.89 | 2.23 | 2.87 | 0.03 | 2.12 | 1.80 | 1.94 | 1.90 |
| 35 | 0 | 0 | 0 | 0 | 0.02 | -0.01 | 0.02 | 0.07 | -1.62 | -0.18 | 0.08 | -0.05 | -0.02 | |
| 36 | Total Earnings Per Share + | 3.12 | 3.14 | 2.26 | 4.69 | 3.43 | 2.88 | 2.25 | 2.94 | 0.03 | 2.12 | 1.88 | 1.89 | 1.88 |
| 37 | 0 | 0 | 0 | 0 | 0 | 0 | 4 | 6 | -134 | -13 | 0 | 0 | 0 |
 Click to Enlarge