| Date | Price $ | Result % | Candle Name | Side |
|---|---|---|---|---|
| 001 01 Apr 2024 | Buy Price: 351.45 | Loss: Close Day2 ($ 308.06) | Engulfing | Buy |
| 002 22 Mar 2024 | Buy Price: 348.54 | Profit: Open Day1 ($ 349.00) | Abandoned Baby | Buy |
| 003 01 Mar 2024 | Buy Price: 352.03 | Loss: Close Day2 ($ 337.92) | Engulfing | Buy |
| 004 01 Mar 2024 | Buy Price: 351.60 | Loss: Close Day2 ($ 337.92) | Piercing Line | Buy |
| 005 22 Feb 2024 | Buy Price: 368.82 | Loss: Close Day2 ($ 359.95) | Engulfing | Buy |
| 006 22 Feb 2024 | Buy Price: 368.08 | Profit: Open Day1 ($ 368.78) | Piercing Line | Buy |
| 007 26 Jan 2024 | Buy Price: 361.23 | Profit: Open Day1 ($ 363.00) | Engulfing | Buy |
| 008 16 Jan 2024 | Buy Price: 438.79 | Profit: Open Day1 ($ 441.48) | Abandoned Baby | Buy |
| 009 17 Nov 2023 | Sell Price: 498.09 | Profit: Open Day1 ($ 497.56) | Engulfing | Sell |
| 010 12 Oct 2023 | Buy Price: 498.77 | Profit: Open Day1 ($ 507.75) | Abandoned Baby | Buy |
| 011 12 Oct 2023 | Buy Price: 499.81 | Profit: Open Day1 ($ 507.75) | Engulfing | Buy |
| 012 20 Sep 2023 | Buy Price: 484.77 | Profit: Open Day1 ($ 486.59) | Abandoned Baby | Buy |
| 013 04 Aug 2023 | Sell Price: 484.28 | Loss: Close Day2 ($ 493.22) | Dark Cloud Cover | Sell |
| 014 08 Jun 2023 | Buy Price: 509.83 | Profit: Open Day1 ($ 510.00) | Engulfing | Buy |
| 015 31 May 2023 | Buy Price: 501.87 | Profit: Open Day1 ($ 502.98) | Abandoned Baby | Buy |
| 016One Year Average | Both Sides Result for 15 Signals |
Loss: $ -62.82 ($ -4.19 / Signal) |
All of Them | Buy + Sell |
| Simple Moving Averages (SMA) Period | Value $ | Signal | Exponential Moving Averages (EMA) Period | Value $ | Signal | |
|---|---|---|---|---|---|---|
| 2 | 313.70 | SELL | 2 | 314.19 | SELL | |
| 3 | 318.46 | SELL | 3 | 316.36 | SELL | |
| 5 | 321.80 | SELL | 5 | 318.59 | SELL | |
| 8 | 321.85 | SELL | 8 | 319.76 | SELL | |
| 13 | 319.78 | SELL | 13 | 321.17 | SELL | |
| 21 | 321.78 | SELL | 21 | 324.55 | SELL | |
| 34 | 331.45 | SELL | 34 | 332.05 | SELL | |
| 55 | 341.99 | SELL | 55 | 346.82 | SELL | |
| 90 | 374.92 | SELL | 90 | 370.46 | SELL | |
| 200 | 436.02 | SELL | 200 | 415.13 | SELL |
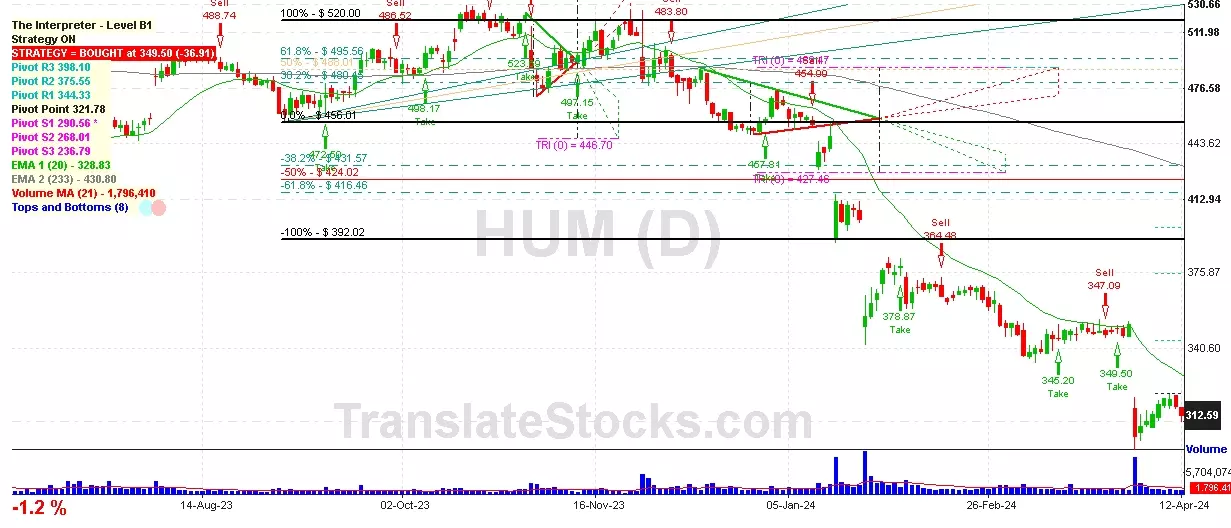
Humana Inc
IPO: 1971-05-18
Ticker: HUMIndices: S&P 500,
Exchange: New York Stock Exchange, Inc. (US - USD)
Website: http://www.humana.com/
Phone:
Common Stock
Finance (
Hospital & Medical Service Plans

 Click to Enlarge