| Date | Price $ | Result % | Candle Name | Side |
|---|---|---|---|---|
| 001 03 Apr 2024 | Buy Price: 459.74 | Profit: Open Day1 ($ 460.82) | Abandoned Baby | Buy |
| 002 01 Apr 2024 | Sell Price: 489.70 | Profit: Open Day1 ($ 459.60) | Abandoned Baby | Sell |
| 003 18 Mar 2024 | Sell Price: 487.05 | Loss: Close Day2 ($ 494.23) | Engulfing | Sell |
| 004 18 Mar 2024 | Sell Price: 487.21 | Loss: Close Day2 ($ 494.23) | Dark Cloud Cover | Sell |
| 005 13 Mar 2024 | Sell Price: 488.00 | Profit: Open Day2 ($ 487.45) | Engulfing | Sell |
| 006 26 Feb 2024 | Sell Price: 525.32 | Profit: Open Day1 ($ 524.76) | Engulfing | Sell |
| 007 17 Nov 2023 | Sell Price: 536.29 | Profit: Open Day1 ($ 533.61) | Engulfing | Sell |
| 008 08 Nov 2023 | Sell Price: 536.73 | Loss: Close Day2 ($ 541.21) | Dark Cloud Cover | Sell |
| 009 18 Sep 2023 | Sell Price: 486.06 | Profit: Open Day1 ($ 483.76) | Dark Cloud Cover | Sell |
| 010 06 Sep 2023 | Sell Price: 476.94 | Loss: Close Day2 ($ 480.77) | Engulfing | Sell |
| 011 15 Aug 2023 | Sell Price: 506.69 | Profit: Close Day1 ($ 503.56) | Engulfing | Sell |
| 012 26 Jul 2023 | Sell Price: 508.00 | Profit: Close Day1 ($ 505.23) | Engulfing | Sell |
| 013 10 Jul 2023 | Buy Price: 463.05 | Loss: Close Day2 ($ 451.70) | Piercing Line | Buy |
| 014 25 May 2023 | Sell Price: 477.70 | Profit: Open Day2 ($ 476.68) | Abandoned Baby | Sell |
| 015 23 May 2023 | Sell Price: 479.44 | Profit: Open Day2 ($ 477.63) | Abandoned Baby | Sell |
| 016One Year Average | Both Sides Result for 15 Signals |
Profit: $ 12.14 ($ 0.81 / Signal) |
All of Them | Buy + Sell |
| Simple Moving Averages (SMA) Period | Value $ | Signal | Exponential Moving Averages (EMA) Period | Value $ | Signal | |
|---|---|---|---|---|---|---|
| 2 | 494.61 | BUY | 2 | 494.17 | BUY | |
| 3 | 492.17 | BUY | 3 | 493.13 | BUY | |
| 5 | 490.78 | BUY | 5 | 490.92 | BUY | |
| 8 | 490.90 | BUY | 8 | 487.00 | BUY | |
| 13 | 474.82 | BUY | 13 | 482.33 | BUY | |
| 21 | 471.52 | BUY | 21 | 479.98 | BUY | |
| 34 | 478.70 | BUY | 34 | 481.77 | BUY | |
| 55 | 489.23 | BUY | 55 | 487.64 | BUY | |
| 90 | 501.33 | SELL | 90 | 495.26 | BUY | |
| 200 | 508.83 | SELL | 200 | 502.31 | SELL |
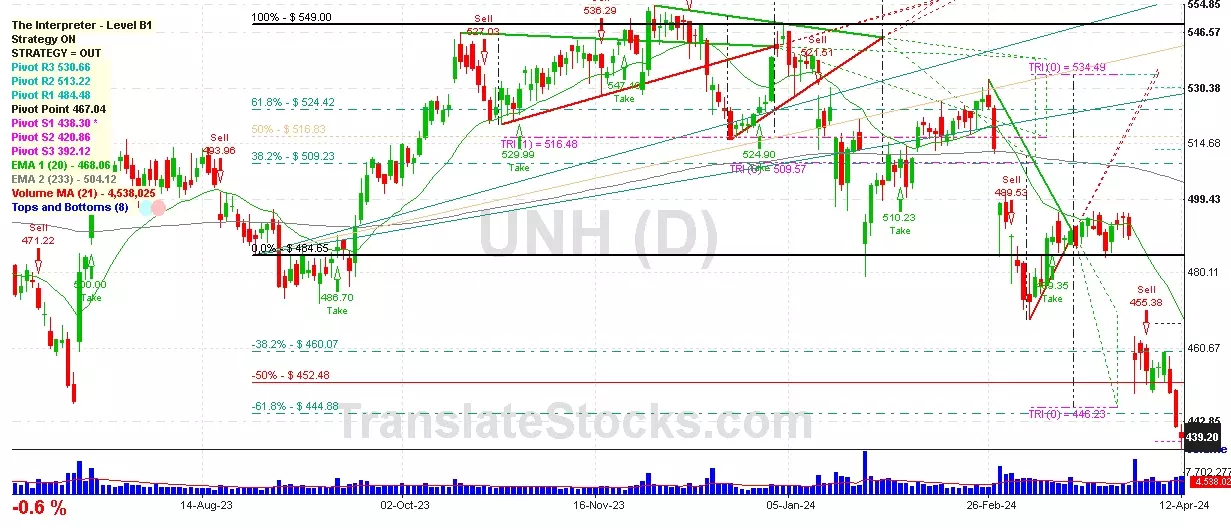
Unitedhealth Group Inc
IPO: 1984-10-17
Website: http://www.unitedhealthgroup.com/
Phone:
Common Stock
Finance (
Hospital & Medical Service Plans

 Click to Enlarge