| Date | Price $ | Result % | Candle Name | Side |
|---|---|---|---|---|
| 001 03 Apr 2024 | Buy Price: 18.19 | Profit: Open Day1 ($ 18.50) | Engulfing | Buy |
| 002 07 Mar 2024 | Sell Price: 18.18 | Profit: Close Day1 ($ 17.99) | Engulfing | Sell |
| 003 29 Nov 2023 | Buy Price: 16.52 | Profit: Open Day1 ($ 16.84) | Abandoned Baby | Buy |
| 004 27 Nov 2023 | Sell Price: 15.60 | Profit: Open Day1 ($ 15.57) | Abandoned Baby | Sell |
| 005 27 Oct 2023 | Buy Price: 15.21 | Profit: Open Day1 ($ 15.36) | Abandoned Baby | Buy |
| 006 19 Sep 2023 | Buy Price: 17.07 | Profit: Open Day1 ($ 17.32) | Abandoned Baby | Buy |
| 007 12 Jul 2023 | Sell Price: 17.08 | Profit: Close Day2 ($ 16.87) | Dark Cloud Cover | Sell |
| 008 29 Jun 2023 | Buy Price: 16.65 | Profit: Open Day1 ($ 16.71) | Abandoned Baby | Buy |
| 009 20 Jun 2023 | Sell Price: 17.01 | Profit: Close Day1 ($ 16.82) | Abandoned Baby | Sell |
| 010 31 May 2023 | Sell Price: 14.42 | Loss: Close Day2 ($ 15.24) | Abandoned Baby | Sell |
| 011 19 May 2023 | Sell Price: 14.33 | Loss: Close Day2 ($ 14.38) | Dark Cloud Cover | Sell |
| 012One Year Average | Both Sides Result for 11 Signals |
Profit: $ 0.84 ($ 0.08 / Signal) |
All of Them | Buy + Sell |
| Simple Moving Averages (SMA) Period | Value $ | Signal | Exponential Moving Averages (EMA) Period | Value $ | Signal | |
|---|---|---|---|---|---|---|
| 2 | 16.95 | BUY | 2 | 16.95 | BUY | |
| 3 | 16.91 | BUY | 3 | 16.93 | BUY | |
| 5 | 16.87 | BUY | 5 | 16.95 | BUY | |
| 8 | 16.95 | BUY | 8 | 17.03 | SELL | |
| 13 | 17.25 | SELL | 13 | 17.15 | SELL | |
| 21 | 17.50 | SELL | 21 | 17.24 | SELL | |
| 34 | 17.48 | SELL | 34 | 17.18 | SELL | |
| 55 | 16.81 | BUY | 55 | 17.00 | SELL | |
| 90 | 16.58 | BUY | 90 | 16.79 | BUY | |
| 200 | 16.66 | BUY | 200 | 16.48 | BUY |
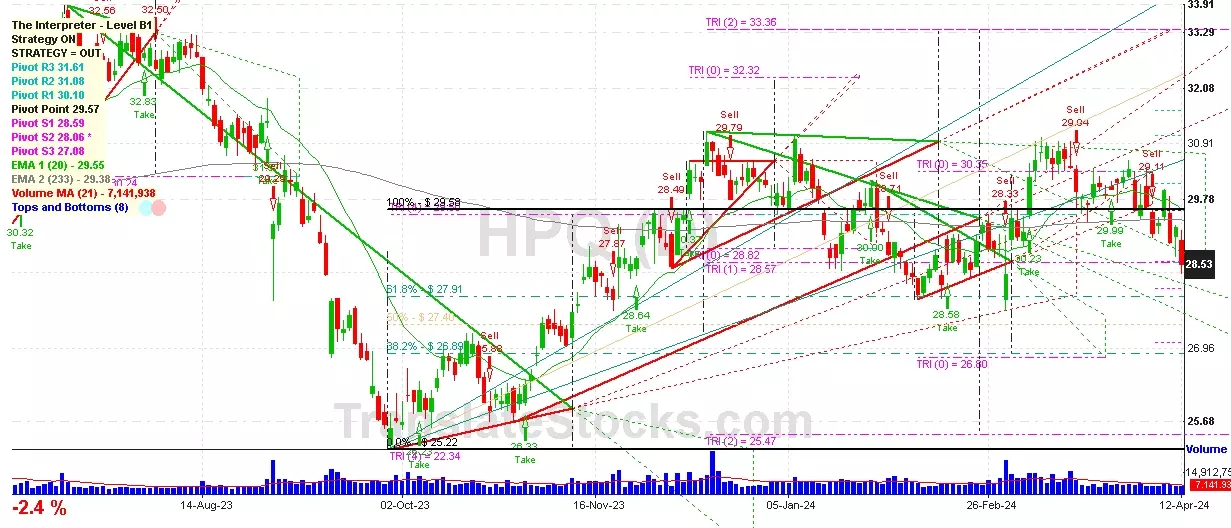
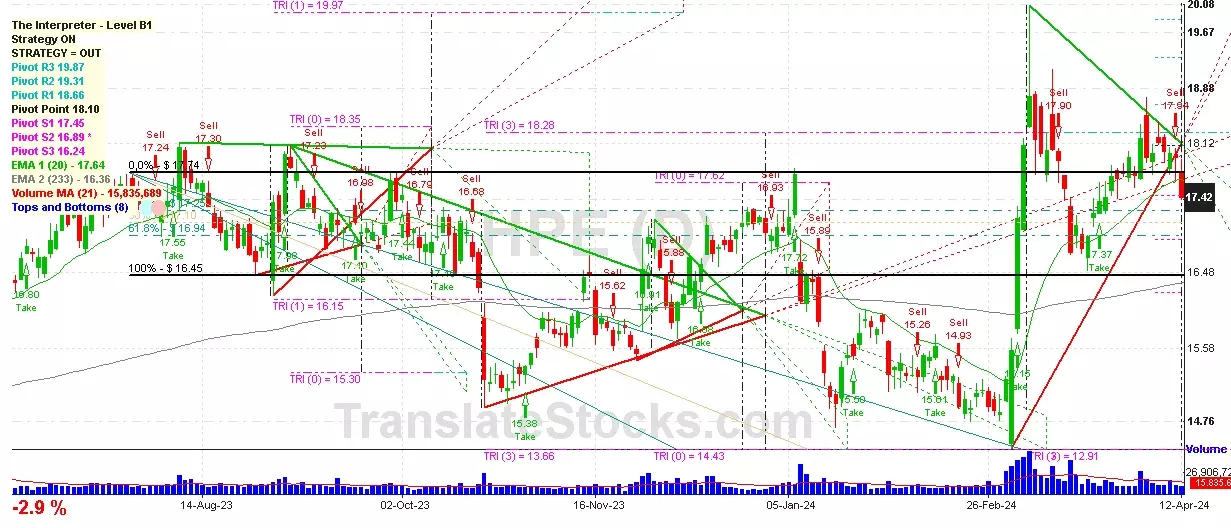
Hewlett Packard Enterprise
IPO: 2015-10-19
Ticker: HPEIndices: S&P 500,
Exchange: New York Stock Exchange, Inc. (US - USD)
Website: http://investors.hpe.com/
Phone:
Common Stock
Trade & Services (
Wholesale-computers & Peripheral Equipment & Software

 Click to Enlarge