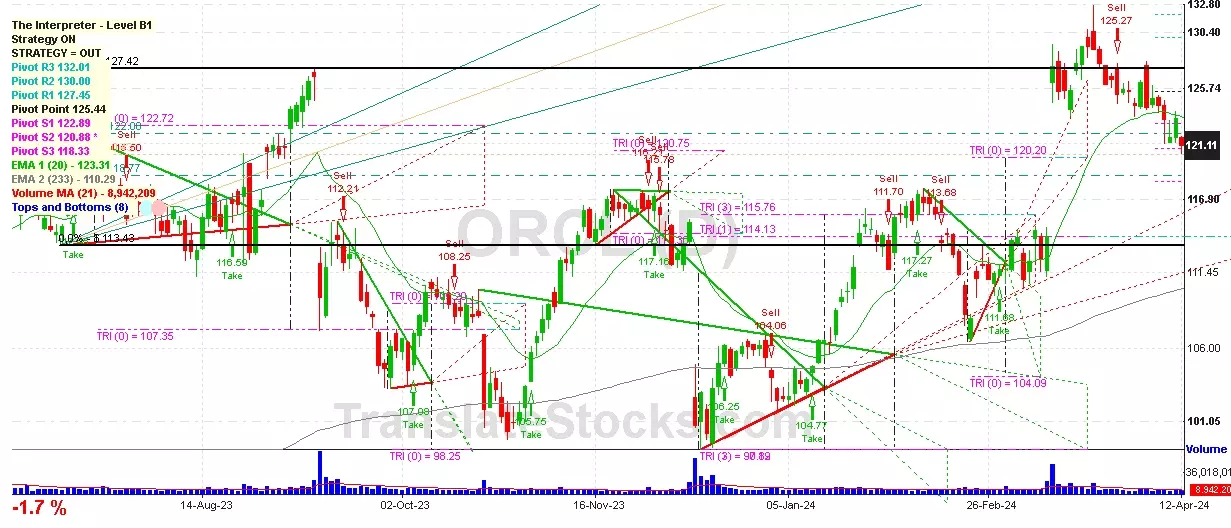
Hey Friend, I'm analysing ORACLE CORP (ORCL), and it is between the Support of $ 120.88 (PivotS2) and the Resistance of $ 122.89 (PivotS1). The stock is also approaching the line of PivotS2 at $ 120.88, and if it goes below this line it could reach the next Support of Triangle projection at $120.75.

| Date | Price $ | Result % | Candle Name | Side |
|---|---|---|---|---|
| 001 04 Apr 2024 | Sell Price: 124.19 | Loss: Close Day2 ($ 124.35) | Engulfing | Sell |
| 002 04 Apr 2024 | Sell Price: 124.41 | Profit: Close Day2 ($ 124.35) | Dark Cloud Cover | Sell |
| 003 13 Mar 2024 | Sell Price: 125.52 | Profit: Open Day2 ($ 124.04) | Engulfing | Sell |
| 004 22 Feb 2024 | Buy Price: 111.01 | Profit: Open Day1 ($ 112.00) | Abandoned Baby | Buy |
| 005 27 Nov 2023 | Buy Price: 116.47 | Profit: Open Day2 ($ 117.34) | Piercing Line | Buy |
| 006 15 Nov 2023 | Sell Price: 114.06 | Profit: Open Day1 ($ 113.76) | Engulfing | Sell |
| 007 18 Sep 2023 | Sell Price: 112.21 | Loss: Close Day2 ($ 112.87) | Abandoned Baby | Sell |
| 008 08 Aug 2023 | Sell Price: 115.23 | Profit: Close Day1 ($ 113.10) | Abandoned Baby | Sell |
| 009 19 Jul 2023 | Sell Price: 118.69 | Profit: Open Day1 ($ 117.49) | Engulfing | Sell |
| 010One Year Average | Both Sides Result for 9 Signals |
Profit: $ 6.21 ($ 0.69 / Signal) |
All of Them | Buy + Sell |
| Simple Moving Averages (SMA) Period | Value $ | Signal | Exponential Moving Averages (EMA) Period | Value $ | Signal | |
|---|---|---|---|---|---|---|
| 2 | 116.05 | BUY | 2 | 116.47 | BUY | |
| 3 | 115.81 | BUY | 3 | 116.15 | BUY | |
| 5 | 115.41 | BUY | 5 | 116.08 | BUY | |
| 8 | 115.83 | BUY | 8 | 116.62 | BUY | |
| 13 | 117.94 | SELL | 13 | 117.80 | SELL | |
| 21 | 120.55 | SELL | 21 | 119.00 | SELL | |
| 34 | 122.67 | SELL | 34 | 119.36 | SELL | |
| 55 | 118.82 | SELL | 55 | 118.48 | SELL | |
| 90 | 114.88 | BUY | 90 | 116.76 | BUY | |
| 200 | 113.74 | BUY | 200 | 112.12 | BUY |
Oracle Corp
IPO: 1986-03-12
Ticker: ORCLIndices: S&P 500,
Exchange: New York Stock Exchange, Inc. (US - USD)
Website: https://www.oracle.com/
Phone:
Common Stock
Technology (
Services-prepackaged Software
 Click to Enlarge