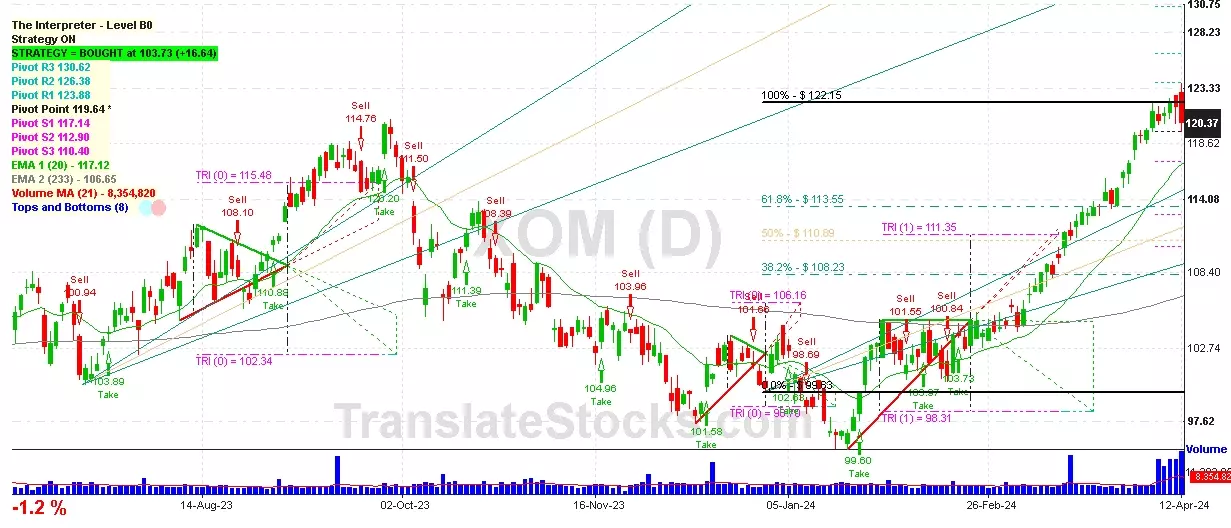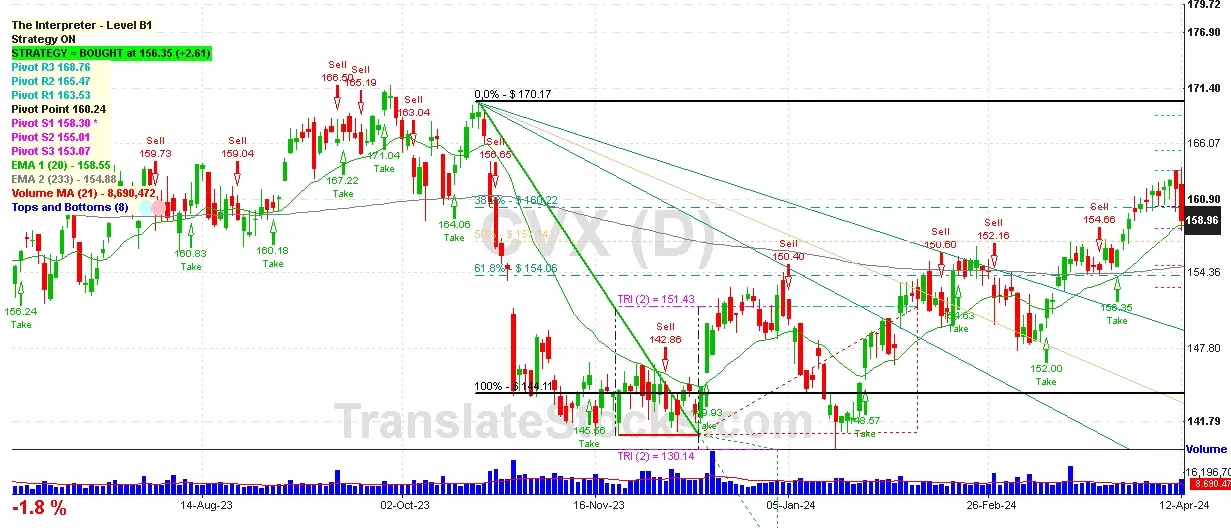
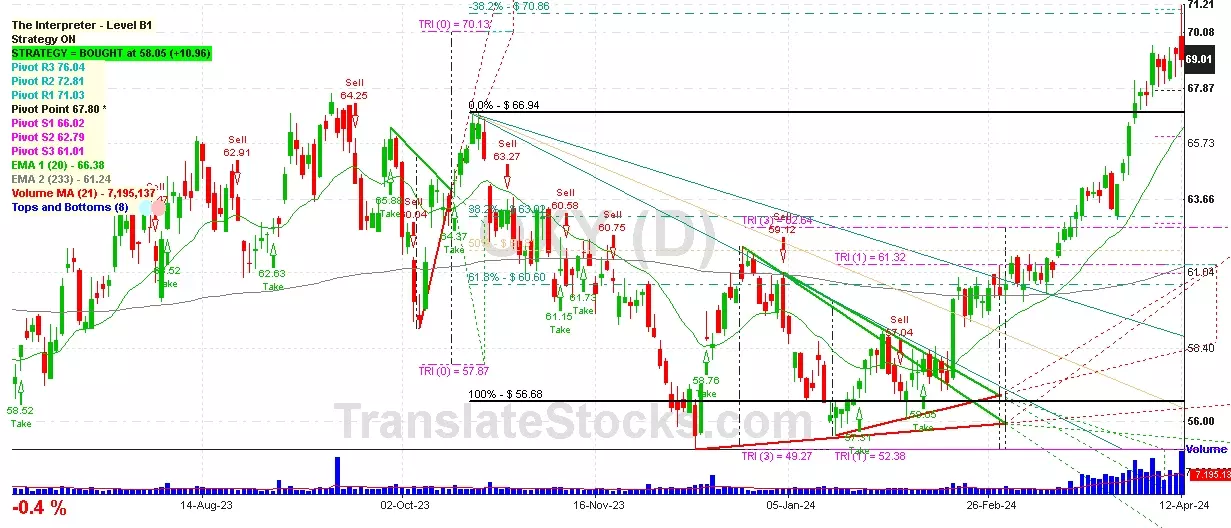
Hey Friend, I'm analysing OCCIDENTAL PETROLEUM CORP (OXY), and it is between the Support of $ 67.80 (Pivot) and the Resistance of $ 70.13 (Triangle Projection Level 0). The stock is also approaching the line of Pivot at $ 67.80, and if it goes below this line it could reach the next Support of 0% of Fibonacci at $ 66.94.

| Date | Price $ | Result % | Candle Name | Side |
|---|---|---|---|---|
| 001 22 Mar 2024 | Sell Price: 63.81 | Profit: Close Day2 ($ 63.32) | Engulfing | Sell |
| 002 22 Mar 2024 | Sell Price: 63.82 | Profit: Close Day2 ($ 63.32) | Dark Cloud Cover | Sell |
| 003 20 Feb 2024 | Sell Price: 59.56 | Loss: Close Day2 ($ 60.53) | Engulfing | Sell |
| 004 16 Jan 2024 | Sell Price: 56.62 | Profit: Open Day1 ($ 56.04) | Abandoned Baby | Sell |
| 005 30 Nov 2023 | Sell Price: 59.15 | Profit: Open Day1 ($ 59.10) | Engulfing | Sell |
| 006 17 Nov 2023 | Buy Price: 60.96 | Profit: Open Day1 ($ 61.44) | Abandoned Baby | Buy |
| 007 15 Sep 2023 | Sell Price: 66.15 | Profit: Close Day2 ($ 65.81) | Abandoned Baby | Sell |
| 008 26 Jun 2023 | Buy Price: 57.25 | Profit: Close Day2 ($ 57.46) | Abandoned Baby | Buy |
| 009 16 May 2023 | Sell Price: 58.14 | Loss: Close Day2 ($ 58.25) | Engulfing | Sell |
| 010One Year Average | Both Sides Result for 9 Signals |
Profit: $ 1.57 ($ 0.17 / Signal) |
All of Them | Buy + Sell |
| Simple Moving Averages (SMA) Period | Value $ | Signal | Exponential Moving Averages (EMA) Period | Value $ | Signal | |
|---|---|---|---|---|---|---|
| 2 | 67.61 | BUY | 2 | 67.68 | BUY | |
| 3 | 67.53 | BUY | 3 | 67.54 | BUY | |
| 5 | 67.25 | BUY | 5 | 67.39 | BUY | |
| 8 | 66.88 | BUY | 8 | 67.34 | BUY | |
| 13 | 67.63 | BUY | 13 | 67.22 | BUY | |
| 21 | 67.40 | BUY | 21 | 66.73 | BUY | |
| 34 | 65.67 | BUY | 34 | 65.69 | BUY | |
| 55 | 63.39 | BUY | 55 | 64.32 | BUY | |
| 90 | 61.46 | BUY | 90 | 63.08 | BUY | |
| 200 | 61.92 | BUY | 200 | 61.96 | BUY |
Occidental Petroleum Corp
IPO: 1964-03-03
Ticker: OXYIndices: S&P 500,
Exchange: New York Stock Exchange, Inc. (US - USD)
Website: http://www.oxy.com
Phone:
Common Stock
Energy & Transportation (
Crude Petroleum & Natural Gas
 Click to Enlarge