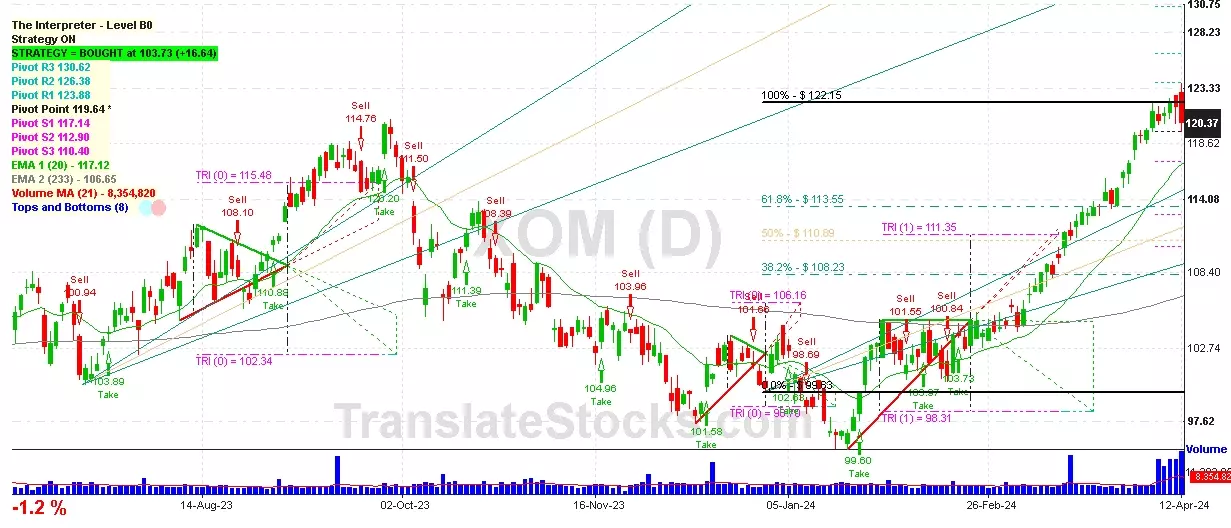
Hey Friend, I'm analysing EXXON MOBIL CORP (XOM), and it is between the Support of $ 119.64 (Pivot) and the Resistance of $ 122.15 (100% of Fibonacci). The stock is also approaching the line of Pivot at $ 119.64, and if it goes below this line it could reach the next Support of 61.8% of Fibonacci at $ 113.55.

| Date | Price $ | Result % | Candle Name | Side |
|---|---|---|---|---|
| 001 11 Apr 2024 | Sell Price: 121.79 | Profit: Close Day1 ($ 120.37) | Dark Cloud Cover | Sell |
| 002 26 Feb 2024 | Buy Price: 104.25 | Profit: Open Day1 ($ 104.68) | Engulfing | Buy |
| 003 06 Feb 2024 | Buy Price: 102.25 | Profit: Open Day2 ($ 102.34) | Abandoned Baby | Buy |
| 004 19 Jan 2024 | Buy Price: 96.99 | Profit: Close Day2 ($ 97.91) | Engulfing | Buy |
| 005 19 Jan 2024 | Buy Price: 96.95 | Profit: Close Day2 ($ 97.91) | Piercing Line | Buy |
| 006 24 Nov 2023 | Buy Price: 104.57 | Loss: Close Day2 ($ 103.90) | Abandoned Baby | Buy |
| 007 01 Jun 2023 | Buy Price: 103.36 | Profit: Open Day1 ($ 105.16) | Engulfing | Buy |
| 008One Year Average | Both Sides Result for 7 Signals |
Profit: $ 4.96 ($ 0.71 / Signal) |
All of Them | Buy + Sell |
| Simple Moving Averages (SMA) Period | Value $ | Signal | Exponential Moving Averages (EMA) Period | Value $ | Signal | |
|---|---|---|---|---|---|---|
| 2 | 121.19 | BUY | 2 | 121.20 | BUY | |
| 3 | 121.14 | BUY | 3 | 121.05 | BUY | |
| 5 | 120.77 | BUY | 5 | 120.77 | BUY | |
| 8 | 119.96 | BUY | 8 | 120.48 | BUY | |
| 13 | 120.38 | BUY | 13 | 119.97 | BUY | |
| 21 | 119.68 | BUY | 21 | 118.76 | BUY | |
| 34 | 116.62 | BUY | 34 | 116.54 | BUY | |
| 55 | 111.80 | BUY | 55 | 113.66 | BUY | |
| 90 | 107.54 | BUY | 90 | 110.99 | BUY | |
| 200 | 107.82 | BUY | 200 | 108.29 | BUY |
Exxon Mobil Corp
IPO: 1980-03-17
Ticker: XOMIndices: S&P 500,
Exchange: New York Stock Exchange, Inc. (US - USD)
Website: http://corporate.exxonmobil.com/
Phone:
Common Stock
Energy & Transportation (
Petroleum Refining
 Click to Enlarge