| Date | Price $ | Result % | Candle Name | Side |
|---|---|---|---|---|
| 001 10 Apr 2024 | Sell Price: 292.08 | Profit: Close Day1 ($ 291.54) | Abandoned Baby | Sell |
| 002 12 Feb 2024 | Buy Price: 267.74 | Loss: Close Day2 ($ 263.14) | Engulfing | Buy |
| 003 10 Jan 2024 | Buy Price: 282.49 | Profit: Open Day1 ($ 282.85) | Abandoned Baby | Buy |
| 004 22 Sep 2023 | Buy Price: 255.86 | Profit: Close Day1 ($ 256.29) | Abandoned Baby | Buy |
| 005 15 Sep 2023 | Sell Price: 260.42 | Profit: Open Day2 ($ 259.98) | Engulfing | Sell |
| 006 05 Sep 2023 | Sell Price: 263.27 | Profit: Open Day1 ($ 262.90) | Engulfing | Sell |
| 007 13 Jul 2023 | Sell Price: 290.59 | Profit: Open Day1 ($ 290.13) | Abandoned Baby | Sell |
| 008 03 Jul 2023 | Sell Price: 286.86 | Profit: Open Day1 ($ 283.87) | Abandoned Baby | Sell |
| 009 13 Jun 2023 | Buy Price: 273.63 | Profit: Open Day1 ($ 274.00) | Engulfing | Buy |
| 010 12 May 2023 | Buy Price: 256.04 | Profit: Open Day1 ($ 256.58) | Abandoned Baby | Buy |
| 011One Year Average | Both Sides Result for 10 Signals |
Profit: $ 1.90 ($ 0.19 / Signal) |
All of Them | Buy + Sell |
| Simple Moving Averages (SMA) Period | Value $ | Signal | Exponential Moving Averages (EMA) Period | Value $ | Signal | |
|---|---|---|---|---|---|---|
| 2 | 271.88 | SELL | 2 | 270.95 | SELL | |
| 3 | 271.70 | SELL | 3 | 271.11 | SELL | |
| 5 | 270.49 | SELL | 5 | 271.87 | SELL | |
| 8 | 272.52 | SELL | 8 | 273.97 | SELL | |
| 13 | 279.48 | SELL | 13 | 277.37 | SELL | |
| 21 | 284.99 | SELL | 21 | 280.71 | SELL | |
| 34 | 287.60 | SELL | 34 | 282.81 | SELL | |
| 55 | 282.40 | SELL | 55 | 283.26 | SELL | |
| 90 | 284.30 | SELL | 90 | 281.90 | SELL | |
| 200 | 275.11 | SELL | 200 | 274.72 | SELL |
Snap-on Inc
IPO: 1978-02-27
Ticker: SNAIndices: S&P 500,
Exchange: New York Stock Exchange, Inc. (US - USD)
Website: https://www.snapon.com/
Phone:
Common Stock
Manufacturing (
Cutlery, Handtools & General Hardware

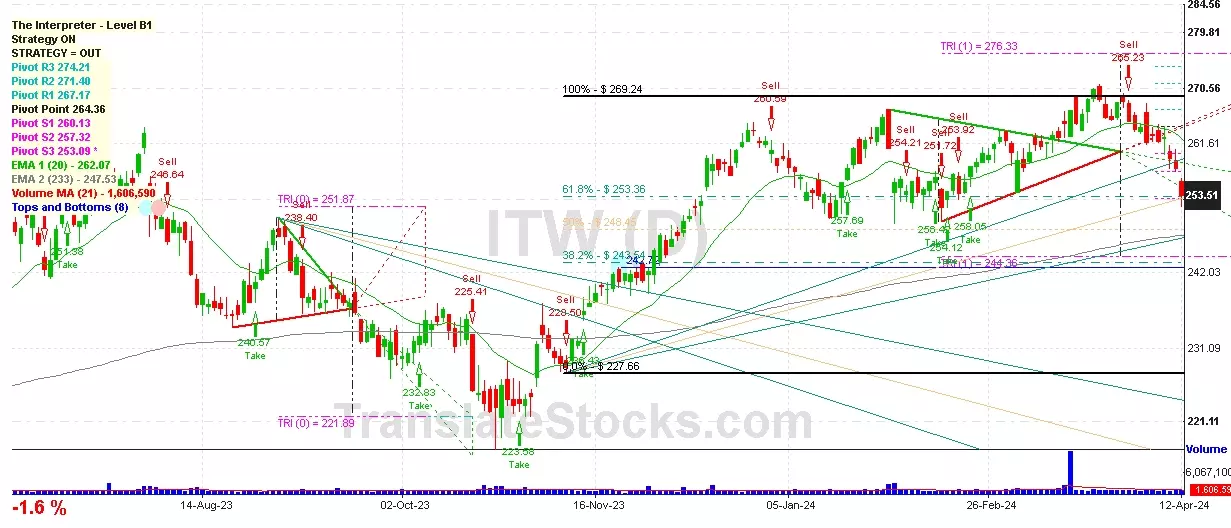
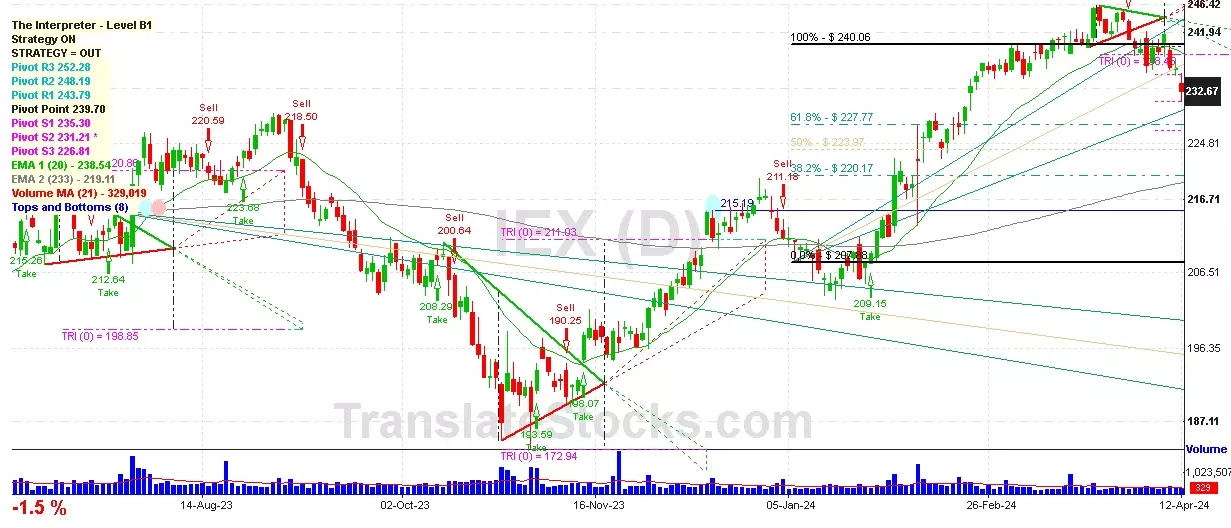
 Click to Enlarge
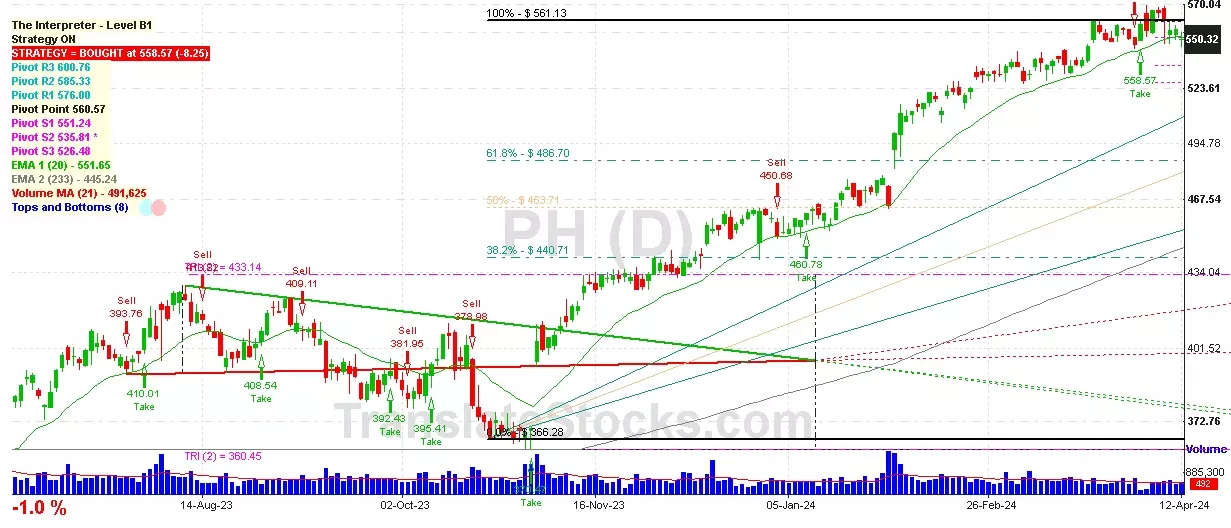
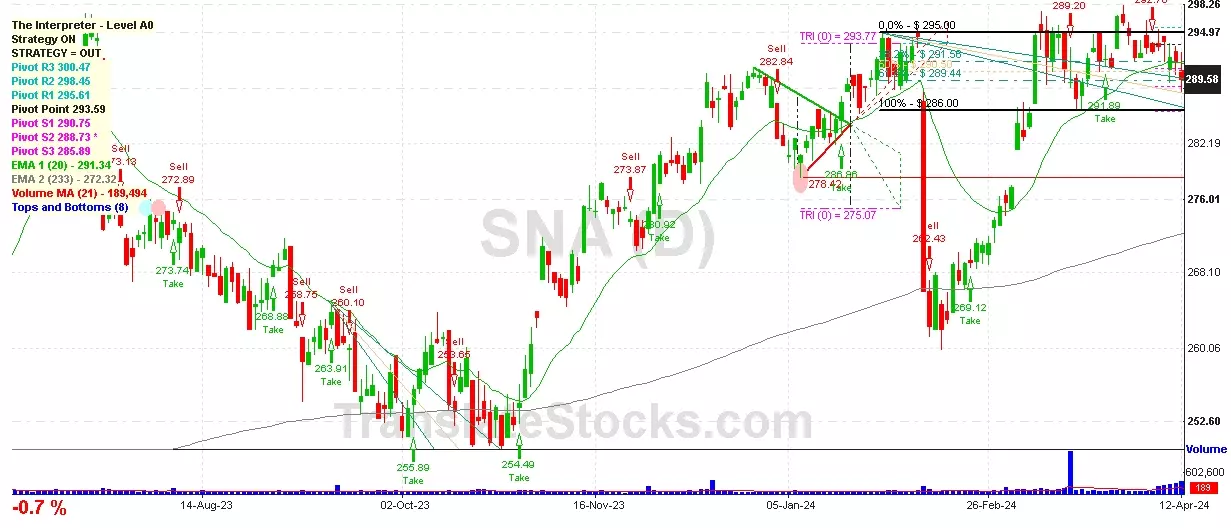