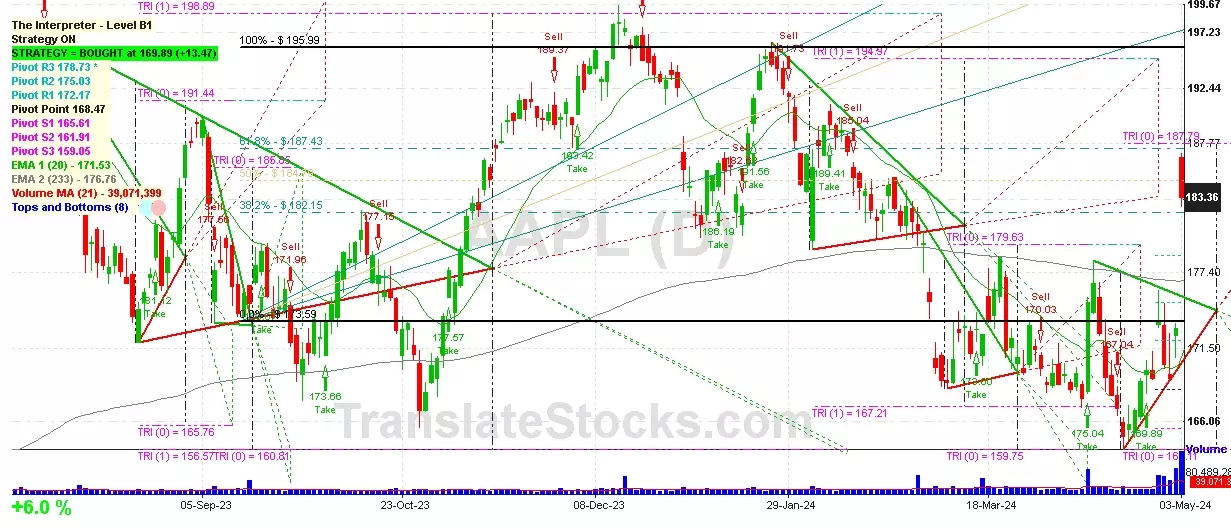
| Date | Price $ | Result % | Candle Name | Side |
|---|---|---|---|---|
| 001 30 Apr 2024 | Sell Price: 170.33 | Profit: Open Day1 ($ 169.58) | Abandoned Baby | Sell |
| 002 14 Mar 2024 | Buy Price: 173.00 | Profit: Open Day2 ($ 175.60) | Abandoned Baby | Buy |
| 003 13 Mar 2024 | Sell Price: 171.13 | Loss: Close Day2 ($ 172.62) | Abandoned Baby | Sell |
| 004 27 Feb 2024 | Buy Price: 182.63 | Loss: Close Day2 ($ 180.75) | Engulfing | Buy |
| 005 23 Feb 2024 | Sell Price: 182.52 | Profit: Open Day1 ($ 182.24) | Engulfing | Sell |
| 006 08 Feb 2024 | Sell Price: 188.32 | Profit: Close Day2 ($ 187.15) | Abandoned Baby | Sell |
| 007 28 Nov 2023 | Buy Price: 190.40 | Profit: Open Day1 ($ 190.90) | Engulfing | Buy |
| 008One Year Average | Both Sides Result for 7 Signals |
Profit: $ 1.93 ($ 0.28 / Signal) |
All of Them | Buy + Sell |
| Simple Moving Averages (SMA) Period | Value $ | Signal | Exponential Moving Averages (EMA) Period | Value $ | Signal | |
|---|---|---|---|---|---|---|
| 2 | 178.20 | BUY | 2 | 179.56 | BUY | |
| 3 | 175.23 | BUY | 3 | 177.45 | BUY | |
| 5 | 173.90 | BUY | 5 | 175.12 | BUY | |
| 8 | 172.22 | BUY | 8 | 173.34 | BUY | |
| 13 | 170.04 | BUY | 13 | 172.04 | BUY | |
| 21 | 170.46 | BUY | 21 | 171.52 | BUY | |
| 34 | 171.01 | BUY | 34 | 172.14 | BUY | |
| 55 | 173.34 | BUY | 55 | 174.06 | BUY | |
| 90 | 179.12 | BUY | 90 | 176.52 | BUY | |
| 200 | 181.19 | BUY | 200 | 177.35 | BUY |
Apple Inc
IPO: 1980-12-12
Ticker: AAPLIndices: Dow 30,
S&P 500,
Nasdaq 100,
Exchange: Nasdaq Nms - Global Market (US - USD)
Website: https://www.apple.com/
Phone:
Common Stock
Technology (
Electronic Computers

 Click to Enlarge