| Date | Price $ | Result % | Candle Name | Side |
|---|---|---|---|---|
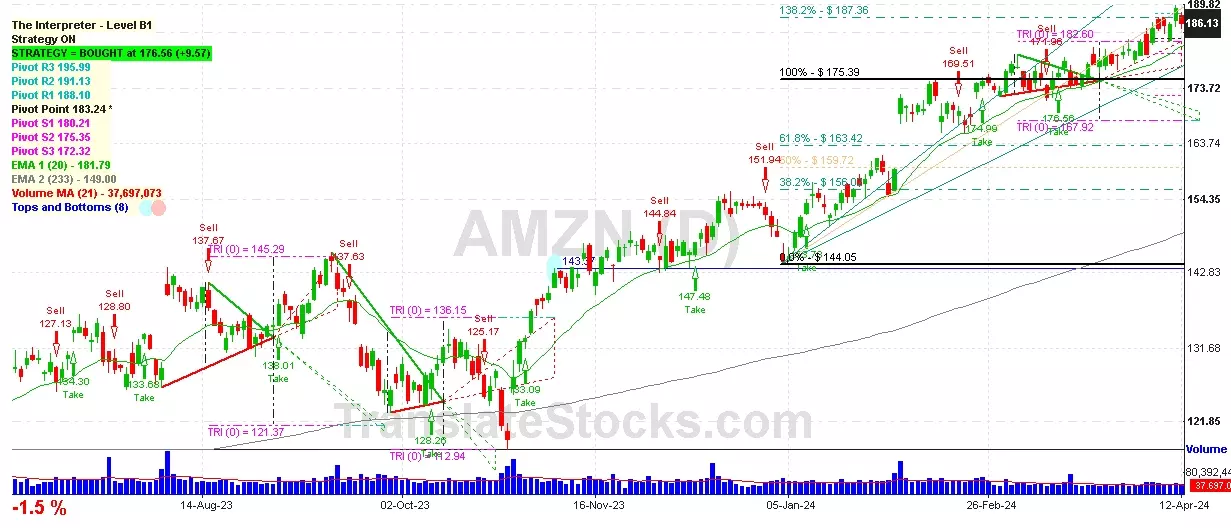
| 001 02 Apr 2024 | Sell Price: 180.69 | Profit: Open Day1 ($ 179.90) | Abandoned Baby | Sell |
| 002 26 Feb 2024 | Sell Price: 174.73 | Profit: Open Day1 ($ 174.08) | Dark Cloud Cover | Sell |
| 003 12 Jan 2024 | Sell Price: 154.62 | Profit: Open Day1 ($ 153.53) | Engulfing | Sell |
| 004 05 Sep 2023 | Sell Price: 137.27 | Profit: Open Day1 ($ 136.32) | Abandoned Baby | Sell |
| 005 22 Aug 2023 | Sell Price: 134.25 | Profit: Close Day2 ($ 131.84) | Dark Cloud Cover | Sell |
| 006 03 Aug 2023 | Buy Price: 128.91 | Profit: Open Day1 ($ 141.06) | Piercing Line | Buy |
| 007 07 Jul 2023 | Buy Price: 129.78 | Loss: Close Day2 ($ 128.78) | Abandoned Baby | Buy |
| 008 31 May 2023 | Sell Price: 120.58 | Loss: Close Day2 ($ 124.25) | Abandoned Baby | Sell |
| 009 24 May 2023 | Buy Price: 116.75 | Profit: Close Day2 ($ 120.11) | Abandoned Baby | Buy |
| 010One Year Average | Both Sides Result for 9 Signals |
Profit: $ 16.74 ($ 1.86 / Signal) |
All of Them | Buy + Sell |
| Simple Moving Averages (SMA) Period | Value $ | Signal | Exponential Moving Averages (EMA) Period | Value $ | Signal | |
|---|---|---|---|---|---|---|
| 2 | 176.65 | BUY | 2 | 178.04 | BUY | |
| 3 | 176.63 | BUY | 3 | 177.62 | BUY | |
| 5 | 177.33 | BUY | 5 | 177.68 | BUY | |
| 8 | 177.72 | BUY | 8 | 178.35 | BUY | |
| 13 | 180.76 | SELL | 13 | 179.25 | BUY | |
| 21 | 181.44 | SELL | 21 | 179.57 | BUY | |
| 34 | 179.73 | SELL | 34 | 178.54 | BUY | |
| 55 | 177.19 | BUY | 55 | 175.34 | BUY | |
| 90 | 168.80 | BUY | 90 | 169.37 | BUY | |
| 200 | 150.90 | BUY | 200 | 178.74 | BUY |
Amazon.com Inc
IPO: 1997-05-15
Ticker: AMZNIndices: S&P 500,
Nasdaq 100,
Exchange: Nasdaq Nms - Global Market (US - USD)
Website: https://www.amazon.com/
Phone:
Common Stock
Trade & Services (
Retail-catalog & Mail-order Houses

 Click to Enlarge