| Date | Price $ | Result % | Candle Name | Side |
|---|---|---|---|---|
| 001 01 Apr 2024 | Sell Price: 54.11 | Profit: Open Day1 ($ 53.62) | Engulfing | Sell |
| 002 02 Jan 2024 | Buy Price: 56.50 | Loss: Close Day2 ($ 55.07) | Engulfing | Buy |
| 003 14 Nov 2023 | Buy Price: 44.18 | Profit: Open Day1 ($ 44.25) | Abandoned Baby | Buy |
| 004 05 Oct 2023 | Buy Price: 40.18 | Profit: Close Day2 ($ 40.51) | Engulfing | Buy |
| 005 28 Sep 2023 | Buy Price: 40.81 | Profit: Open Day1 ($ 41.29) | Engulfing | Buy |
| 006 05 Sep 2023 | Sell Price: 48.52 | Profit: Open Day1 ($ 48.01) | Abandoned Baby | Sell |
| 007 03 Aug 2023 | Buy Price: 52.94 | Profit: Close Day1 ($ 53.03) | Abandoned Baby | Buy |
| 008 19 May 2023 | Sell Price: 38.34 | Loss: Close Day2 ($ 40.40) | Dark Cloud Cover | Sell |
| 009One Year Average | Both Sides Result for 8 Signals |
Loss: $ -1.52 ($ -0.19 / Signal) |
All of Them | Buy + Sell |
| Simple Moving Averages (SMA) Period | Value $ | Signal | Exponential Moving Averages (EMA) Period | Value $ | Signal | |
|---|---|---|---|---|---|---|
| 2 | 52.11 | SELL | 2 | 52.16 | SELL | |
| 3 | 52.39 | SELL | 3 | 52.21 | SELL | |
| 5 | 52.48 | SELL | 5 | 52.16 | SELL | |
| 8 | 51.81 | BUY | 8 | 52.05 | BUY | |
| 13 | 51.51 | BUY | 13 | 52.01 | BUY | |
| 21 | 52.38 | SELL | 21 | 51.99 | BUY | |
| 34 | 52.02 | BUY | 34 | 51.93 | BUY | |
| 55 | 51.43 | BUY | 55 | 51.74 | BUY | |
| 90 | 52.54 | SELL | 90 | 51.16 | BUY | |
| 200 | 48.76 | BUY | 200 | 50.77 | BUY |
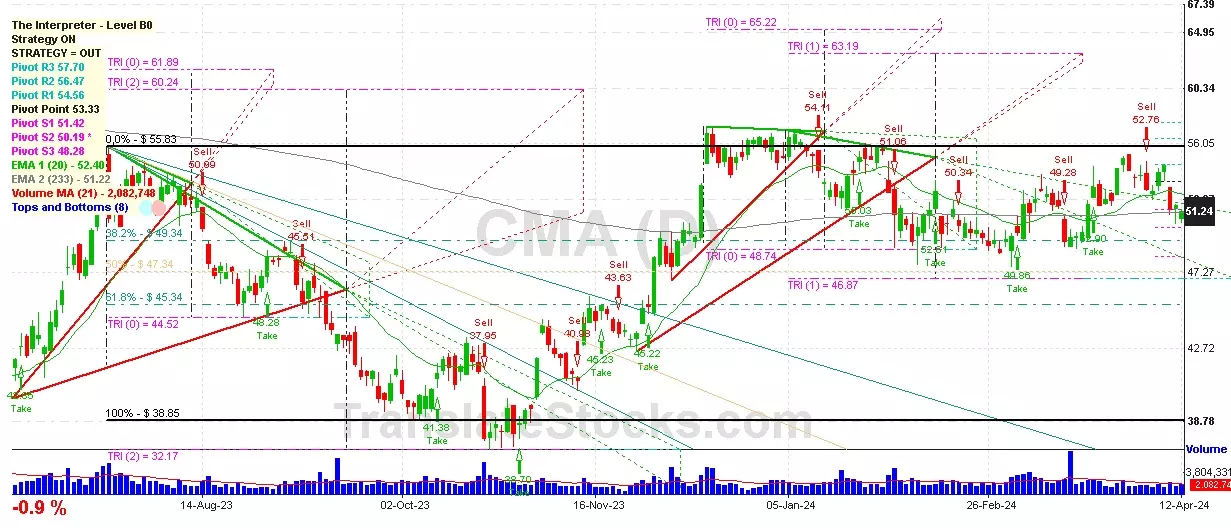
Comerica Inc
IPO: 1991-04-02
Ticker: CMAIndices: S&P 500,
Exchange: New York Stock Exchange, Inc. (US - USD)
Website: https://www.comerica.com/
Phone:
Common Stock
Finance (
National Commercial Banks

 Click to Enlarge