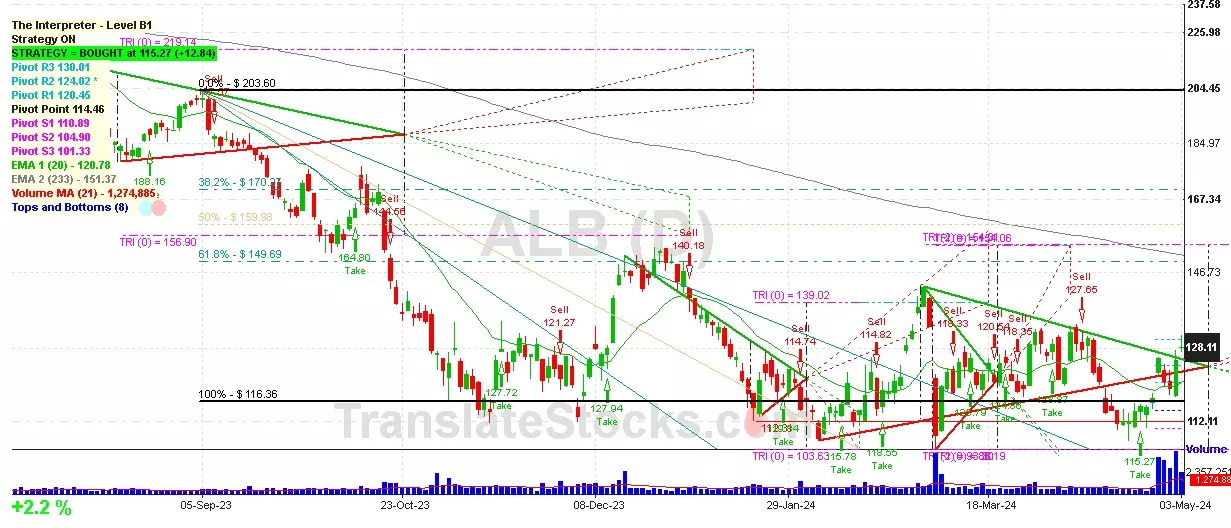
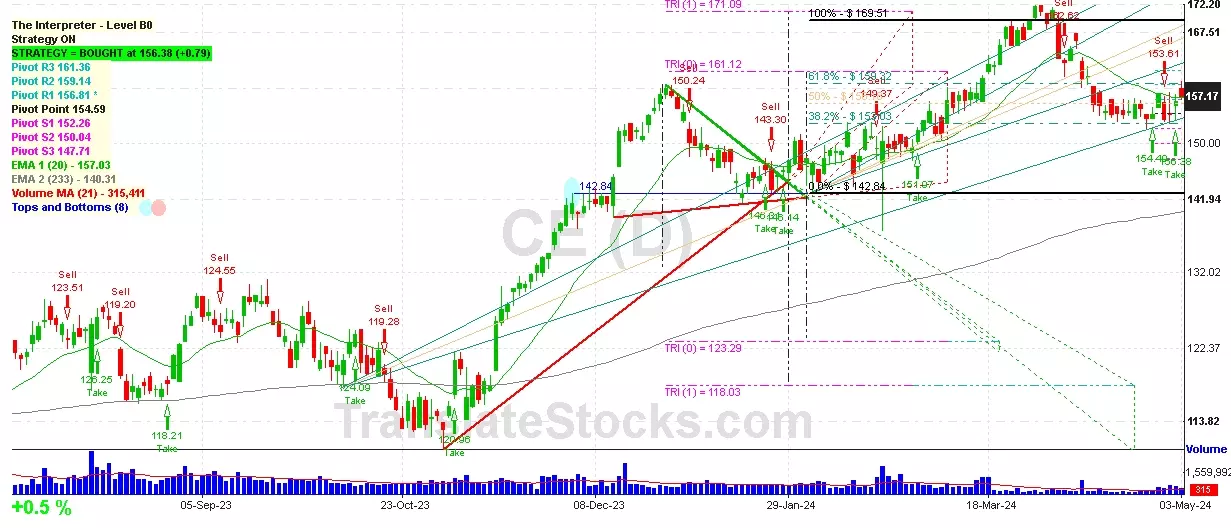
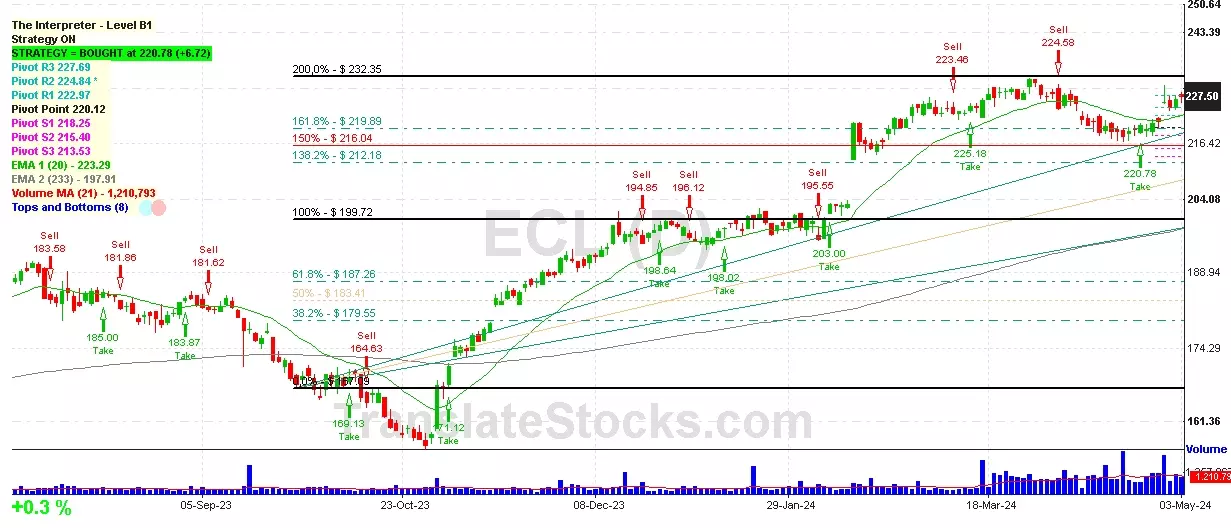
logo
  • The Interpreter

    Hey Friend, I'm analysing ECOLAB INC (ECL), and it is between the Support of $ 224.84 (PivotR2) and the Resistance of $ 227.69 (PivotR3). The stock is falling and may come close and reach $ 224.84 soon.

Ecolab Inc (ECL)

$ 227.50 +0.3%

Last Close 03-May-24

Next Support: $ 224.84


Pivot R2: $ 224.84
Fibonacci 161.8%: $ 219.89

Next Resistance: $ 227.69


Pivot R3: $ 227.69
Fibonacci 200%: $ 232.35


    Supports and Resistances
ImageClick to Enlarge
        

Date Price $ Result % Candle Name Side
001 01 May 2024 Sell Price: 224.98 Profit: Open Day1 ($ 224.83) Engulfing Sell
002 25 Mar 2024 Sell Price: 227.07 Profit: Open Day1 ($ 226.93) Engulfing Sell
003 31 Jan 2024 Sell Price: 198.22 Profit: Open Day1 ($ 197.82) Engulfing Sell
004 20 Dec 2023 Sell Price: 194.85 Loss: Close Day2 ($ 197.59) Abandoned Baby Sell
005 13 Jul 2023 Sell Price: 186.33 Profit: Open Day1 ($ 186.15) Engulfing Sell
006One Year Average Both Sides Result for 5 Signals Loss: $ -1.87 ($ -0.37 / Signal)
-0.9% Gross in 1 Year
All of Them Buy + Sell

Trading Rules for Candlesticks Patterns.
  1. Buy or Sell on the same day of the signal, during the after-hours trading session.
  2. Watch the Opening and Closing of the next 2 days (4 in total).
  3. Immediately exit the Trade when one of them (Open or Close, Day 1 or 2) gives you a profit.
  4. The table above will show the first Profit opportunity, but not in real-time. Therefore, you must watch the market in real-time with your broker.
Remember: The returns an asset made in the past don't mean that future returns will be the same.

Find The Lastest Buy Signals for ECL Below.


Please Subscribe to See
The Latest Trade Signals


Bought Moving Averages

Sold Moving Averages

Simple Moving Averages (SMA) Period Value $ Signal   Exponential Moving Averages (EMA) Period Value $ Signal
2227.13 BUY   2227.04 BUY
3226.41 BUY   3226.52 BUY
5225.41 BUY   5225.50 BUY
8223.59 BUY   8224.39 BUY
13221.87 BUY   13223.56 BUY
21222.32 BUY   21223.27 BUY
34224.62 BUY   34222.63 BUY
55223.76 BUY   55220.05 BUY
90214.52 BUY   90214.40 BUY
200195.34 BUY   200200.49 BUY

Latest News +


Name & IPO

Ecolab Inc
IPO: 1957-01-01

Stock Ticker & Exchange

Ticker: ECLIndices: S&P 500,
Exchange: New York Stock Exchange, Inc. (US - USD)

Contact

Website: https://www.ecolab.com/
Phone:

Stock Type

Common Stock

SIC Office

Life Sciences ()

Industry

Soap, Detergents, Cleang Preparations, Perfumes, Cosmetics

EIN

Fiscal Year End

State of Inc.


in USD millions (if not decimal) - Dictionary

in USD millions (if not decimal) - Dictionary

Statements sources
The financial statements are based on the company's filings with the The U.S. Securities and Exchange Commission (SEC) through the Electronic Data Gathering, Analysis, and Retrieval system (EDGAR). The information is derived from the 10-K and 10-Q reports submitted to the SEC in XBRL (eXtensible Business Reporting Language) format and presented according to the US GAAP Taxonomy. Please review the original filings for a more detailed information.

SEC Filings (click for details)   SEC Filings Web Page for Ecolab Inc

Stock Peers for ECL

Settings
Color Scheme

Left Sidebar