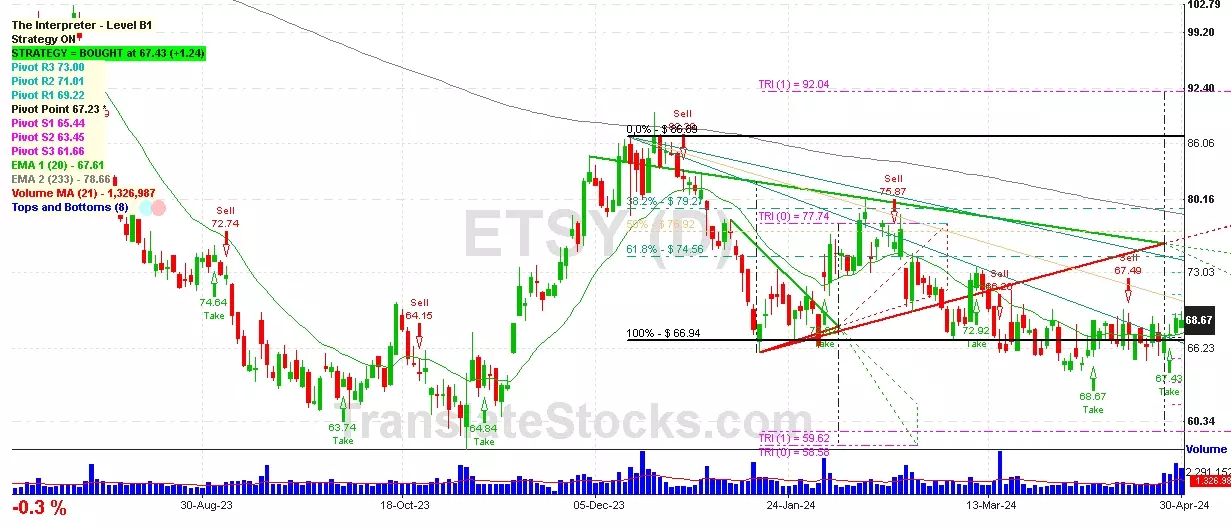
Hey Friend, I'm analysing ETSY INC (ETSY), and it is between the Support of $ 67.23 (Pivot) and the Resistance of $ 69.22 (PivotR1). The stock is also approaching the line of PivotR1 at $ 69.22, and if it goes above this line it could reach the next Resistance of 61.8% of Fibonacci at $ 74.56.

| Date | Price $ | Result % | Candle Name | Side |
|---|---|---|---|---|
| 001 25 Apr 2024 | Buy Price: 67.20 | Profit: Open Day1 ($ 67.35) | Piercing Line | Buy |
| 002 01 Apr 2024 | Sell Price: 65.90 | Profit: Open Day1 ($ 64.90) | Abandoned Baby | Sell |
| 003 13 Feb 2024 | Sell Price: 74.39 | Loss: Close Day2 ($ 77.76) | Abandoned Baby | Sell |
| 004 02 Nov 2023 | Buy Price: 61.63 | Profit: Open Day1 ($ 63.62) | Engulfing | Buy |
| 005 02 Nov 2023 | Buy Price: 61.61 | Profit: Open Day1 ($ 63.62) | Piercing Line | Buy |
| 006 30 Oct 2023 | Sell Price: 61.31 | Profit: Close Day2 ($ 60.66) | Engulfing | Sell |
| 007 24 Oct 2023 | Buy Price: 64.59 | Loss: Close Day2 ($ 62.37) | Abandoned Baby | Buy |
| 008One Year Average | Both Sides Result for 7 Signals |
Profit: $ 0.21 ($ 0.03 / Signal) |
All of Them | Buy + Sell |
| Simple Moving Averages (SMA) Period | Value $ | Signal | Exponential Moving Averages (EMA) Period | Value $ | Signal | |
|---|---|---|---|---|---|---|
| 2 | 68.78 | SELL | 2 | 68.57 | BUY | |
| 3 | 68.33 | BUY | 3 | 68.38 | BUY | |
| 5 | 67.81 | BUY | 5 | 68.11 | BUY | |
| 8 | 67.58 | BUY | 8 | 67.86 | BUY | |
| 13 | 67.51 | BUY | 13 | 67.66 | BUY | |
| 21 | 67.11 | BUY | 21 | 67.63 | BUY | |
| 34 | 67.18 | BUY | 34 | 68.03 | BUY | |
| 55 | 69.31 | SELL | 55 | 68.95 | SELL | |
| 90 | 71.49 | SELL | 90 | 70.30 | SELL | |
| 200 | 72.68 | SELL | 200 | 76.00 | SELL |
Etsy Inc
IPO: 2015-04-16
Ticker: ETSYIndices: S&P 500,
Exchange: Nasdaq Nms - Global Market (US - USD)
Website: https://www.etsy.com/
Phone:
Common Stock
Trade & Services (
Services-business Services, Nec
 Click to Enlarge