| Date | Price $ | Result % | Candle Name | Side |
|---|---|---|---|---|
| 001 11 Apr 2024 | Buy Price: 68.22 | Loss: Close Day2 ($ 64.73) | Abandoned Baby | Buy |
| 002 01 Apr 2024 | Sell Price: 67.82 | Profit: Open Day1 ($ 66.97) | Dark Cloud Cover | Sell |
| 003 28 Mar 2024 | Buy Price: 68.31 | Profit: Open Day1 ($ 68.73) | Engulfing | Buy |
| 004 16 Jan 2024 | Sell Price: 62.00 | Profit: Open Day1 ($ 61.20) | Abandoned Baby | Sell |
| 005 15 Nov 2023 | Sell Price: 50.98 | Profit: Open Day1 ($ 50.71) | Engulfing | Sell |
| 006 15 Nov 2023 | Sell Price: 51.06 | Profit: Open Day1 ($ 50.71) | Dark Cloud Cover | Sell |
| 007 16 Jun 2023 | Sell Price: 72.78 | Profit: Open Day1 ($ 72.45) | Dark Cloud Cover | Sell |
| 008One Year Average | Both Sides Result for 7 Signals |
Loss: $ -0.48 ($ -0.07 / Signal) |
All of Them | Buy + Sell |
| Simple Moving Averages (SMA) Period | Value $ | Signal | Exponential Moving Averages (EMA) Period | Value $ | Signal | |
|---|---|---|---|---|---|---|
| 2 | 62.04 | SELL | 2 | 60.80 | SELL | |
| 3 | 62.54 | SELL | 3 | 61.65 | SELL | |
| 5 | 63.02 | SELL | 5 | 62.48 | SELL | |
| 8 | 63.59 | SELL | 8 | 63.13 | SELL | |
| 13 | 63.79 | SELL | 13 | 63.87 | SELL | |
| 21 | 65.18 | SELL | 21 | 64.77 | SELL | |
| 34 | 66.38 | SELL | 34 | 65.61 | SELL | |
| 55 | 67.55 | SELL | 55 | 65.83 | SELL | |
| 90 | 66.04 | SELL | 90 | 65.18 | SELL | |
| 200 | 62.16 | SELL | 200 | 65.71 | SELL |
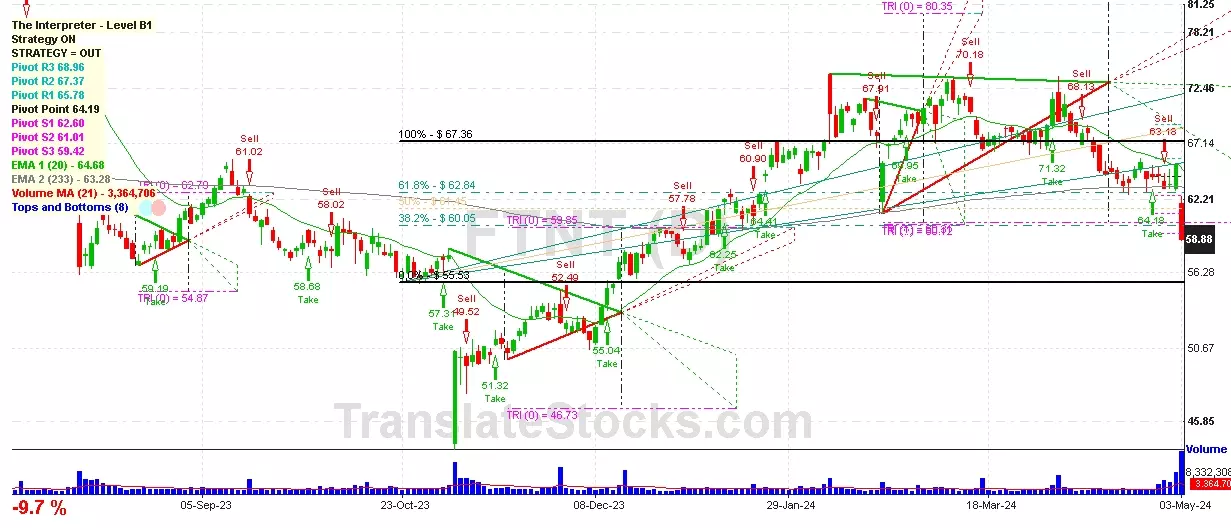
Fortinet Inc
IPO: 2009-06-08
Ticker: FTNTIndices: S&P 500,
Exchange: Nasdaq Nms - Global Market (US - USD)
Website: https://www.fortinet.com/
Phone:
Common Stock
Technology (
Computer Peripheral Equipment, Nec

 Click to Enlarge