| Date | Price $ | Result % | Candle Name | Side |
|---|---|---|---|---|
| 001 04 Apr 2024 | Sell Price: 13.52 | Profit: Open Day1 ($ 13.45) | Engulfing | Sell |
| 002 01 Mar 2024 | Sell Price: 12.95 | Loss: Close Day2 ($ 13.66) | Abandoned Baby | Sell |
| 003 09 Feb 2024 | Buy Price: 12.41 | Profit: Open Day1 ($ 12.47) | Abandoned Baby | Buy |
| 004 02 Jan 2024 | Buy Price: 12.86 | Loss: Close Day2 ($ 12.73) | Engulfing | Buy |
| 005 20 Nov 2023 | Sell Price: 11.07 | Profit: Open Day1 ($ 11.00) | Abandoned Baby | Sell |
| 006 14 Nov 2023 | Buy Price: 10.82 | Profit: Open Day1 ($ 10.83) | Abandoned Baby | Buy |
| 007 26 Oct 2023 | Buy Price: 9.71 | Loss: Close Day2 ($ 9.56) | Abandoned Baby | Buy |
| 008 05 Sep 2023 | Sell Price: 11.16 | Profit: Open Day1 ($ 11.08) | Abandoned Baby | Sell |
| 009 14 Jul 2023 | Sell Price: 11.25 | Profit: Open Day1 ($ 11.20) | Dark Cloud Cover | Sell |
| 010 31 May 2023 | Sell Price: 10.31 | Loss: Close Day2 ($ 10.89) | Abandoned Baby | Sell |
| 011One Year Average | Both Sides Result for 10 Signals |
Loss: $ -1.23 ($ -0.12 / Signal) |
All of Them | Buy + Sell |
| Simple Moving Averages (SMA) Period | Value $ | Signal | Exponential Moving Averages (EMA) Period | Value $ | Signal | |
|---|---|---|---|---|---|---|
| 2 | 13.57 | SELL | 2 | 13.57 | SELL | |
| 3 | 13.63 | SELL | 3 | 13.58 | SELL | |
| 5 | 13.61 | SELL | 5 | 13.55 | SELL | |
| 8 | 13.46 | BUY | 8 | 13.52 | BUY | |
| 13 | 13.41 | BUY | 13 | 13.50 | BUY | |
| 21 | 13.54 | BUY | 21 | 13.47 | BUY | |
| 34 | 13.46 | BUY | 34 | 13.41 | BUY | |
| 55 | 13.26 | BUY | 55 | 13.24 | BUY | |
| 90 | 13.05 | BUY | 90 | 12.93 | BUY | |
| 200 | 11.90 | BUY | 200 | 12.42 | BUY |
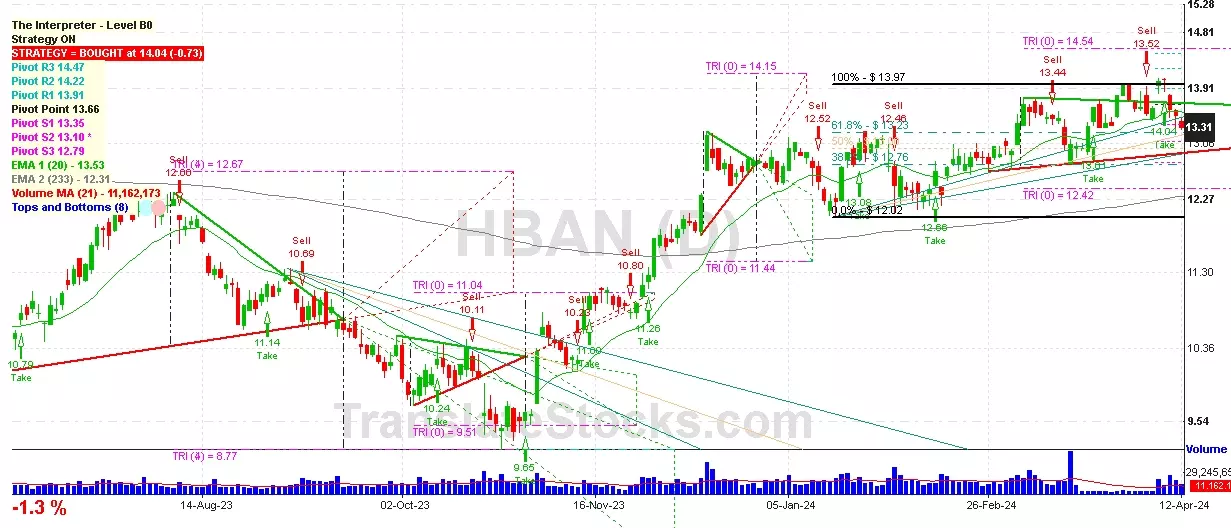
Huntington Bancshares Inc
IPO: 2009-09-18
Ticker: HBANIndices: S&P 500,
Exchange: Nasdaq Nms - Global Market (US - USD)
Website: https://www.huntington.com/
Phone:
Common Stock
Finance (
National Commercial Banks

 Click to Enlarge