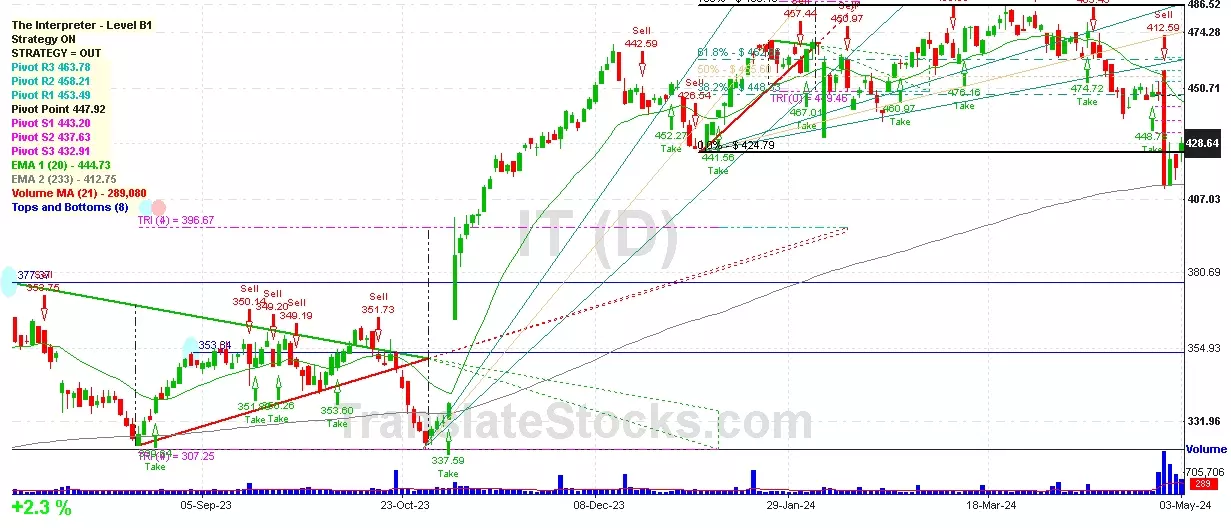
Hey Friend, I'm analysing GARTNER INC (IT), and it is between the Support of $ 424.79 (0% of Fibonacci) and the Resistance of $ 432.91 (PivotS3). The stock is also approaching the line of PivotS3 at $ 432.91, and if it goes above this line it could reach the next Resistance of 38.2% of Fibonacci at $ 448.33.

| Date | Price $ | Result % | Candle Name | Side |
|---|---|---|---|---|
| 001 25 Apr 2024 | Sell Price: 446.31 | Loss: Close Day2 ($ 448.65) | Abandoned Baby | Sell |
| 002 03 Apr 2024 | Buy Price: 472.09 | Profit: Open Day1 ($ 475.43) | Piercing Line | Buy |
| 003 08 Mar 2024 | Sell Price: 463.56 | Profit: Open Day1 ($ 461.19) | Abandoned Baby | Sell |
| 004 24 Nov 2023 | Sell Price: 426.85 | Profit: Open Day1 ($ 426.83) | Abandoned Baby | Sell |
| 005 20 Oct 2023 | Sell Price: 348.76 | Profit: Open Day1 ($ 345.90) | Engulfing | Sell |
| 006 19 Oct 2023 | Buy Price: 353.03 | Profit: Open Day1 ($ 353.41) | Abandoned Baby | Buy |
| 007 13 Sep 2023 | Buy Price: 353.19 | Profit: Open Day1 ($ 355.13) | Abandoned Baby | Buy |
| 008 31 Aug 2023 | Sell Price: 349.68 | Profit: Open Day2 ($ 348.75) | Dark Cloud Cover | Sell |
| 009 20 Jun 2023 | Sell Price: 353.36 | Profit: Open Day1 ($ 353.21) | Abandoned Baby | Sell |
| 010 02 Jun 2023 | Buy Price: 345.01 | Loss: Close Day2 ($ 339.38) | Abandoned Baby | Buy |
| 011One Year Average | Both Sides Result for 10 Signals |
Profit: $ 4.02 ($ 0.40 / Signal) |
All of Them | Buy + Sell |
| Simple Moving Averages (SMA) Period | Value $ | Signal | Exponential Moving Averages (EMA) Period | Value $ | Signal | |
|---|---|---|---|---|---|---|
| 2 | 423.84 | BUY | 2 | 425.89 | BUY | |
| 3 | 423.36 | BUY | 3 | 425.70 | BUY | |
| 5 | 426.26 | BUY | 5 | 427.94 | BUY | |
| 8 | 434.68 | SELL | 8 | 432.22 | SELL | |
| 13 | 439.24 | SELL | 13 | 438.42 | SELL | |
| 21 | 449.90 | SELL | 21 | 445.44 | SELL | |
| 34 | 459.77 | SELL | 34 | 451.51 | SELL | |
| 55 | 460.90 | SELL | 55 | 453.83 | SELL | |
| 90 | 457.81 | SELL | 90 | 448.60 | SELL | |
| 200 | 411.28 | BUY | 200 | 419.99 | BUY |
Gartner Inc
IPO: 1998-09-15
Ticker: ITIndices: S&P 500,
Exchange: New York Stock Exchange, Inc. (US - USD)
Website: https://www.gartner.com/en
Phone:
Common Stock
Trade & Services (
Services-management Services
 Click to Enlarge