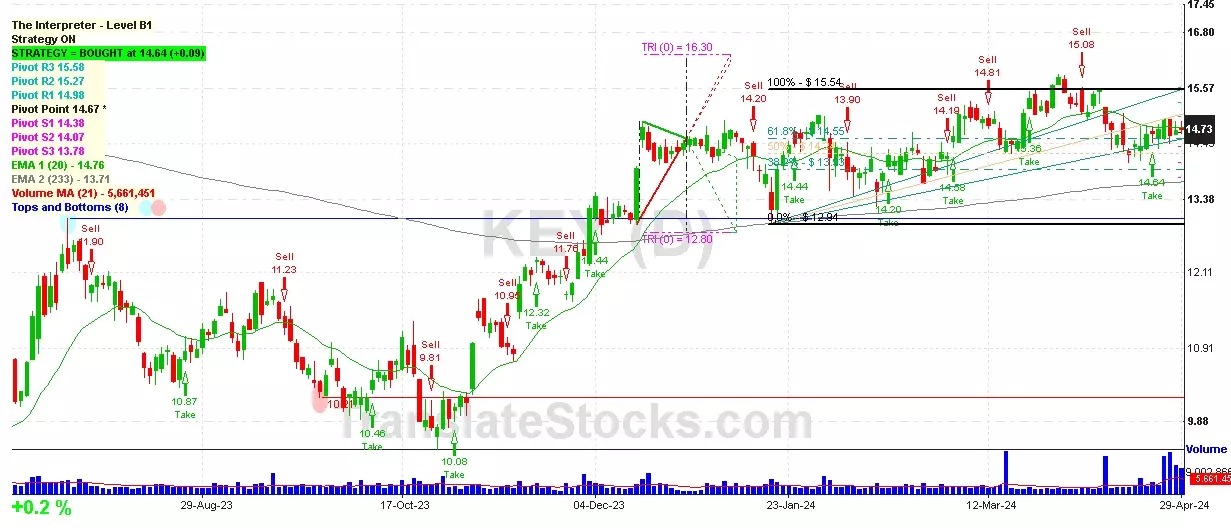
Hey Friend, I'm analysing KEYCORP (KEY), and it is between the Support of $ 14.67 (Pivot) and the Resistance of $ 14.98 (PivotR1). The stock is also approaching the line of Pivot at $ 14.67, and if it goes below this line it could reach the next Support of 61.8% of Fibonacci at $ 14.55.

| Date | Price $ | Result % | Candle Name | Side |
|---|---|---|---|---|
| 001 07 Mar 2024 | Sell Price: 14.97 | Profit: Close Day1 ($ 14.92) | Dark Cloud Cover | Sell |
| 002 09 Feb 2024 | Buy Price: 13.89 | Profit: Open Day1 ($ 13.90) | Abandoned Baby | Buy |
| 003 28 Nov 2023 | Buy Price: 11.93 | Profit: Open Day1 ($ 12.02) | Engulfing | Buy |
| 004 06 Nov 2023 | Sell Price: 11.27 | Profit: Open Day1 ($ 11.16) | Engulfing | Sell |
| 005 30 May 2023 | Buy Price: 9.93 | Loss: Close Day2 ($ 9.62) | Abandoned Baby | Buy |
| 006One Year Average | Both Sides Result for 5 Signals |
Loss: $ -0.05 ($ -0.01 / Signal) |
All of Them | Buy + Sell |
| Simple Moving Averages (SMA) Period | Value $ | Signal | Exponential Moving Averages (EMA) Period | Value $ | Signal | |
|---|---|---|---|---|---|---|
| 2 | 14.72 | BUY | 2 | 14.72 | BUY | |
| 3 | 14.68 | BUY | 3 | 14.72 | BUY | |
| 5 | 14.74 | SELL | 5 | 14.70 | BUY | |
| 8 | 14.67 | BUY | 8 | 14.70 | BUY | |
| 13 | 14.60 | BUY | 13 | 14.72 | BUY | |
| 21 | 14.84 | SELL | 21 | 14.76 | SELL | |
| 34 | 14.89 | SELL | 34 | 14.75 | SELL | |
| 55 | 14.67 | BUY | 55 | 14.62 | BUY | |
| 90 | 14.53 | BUY | 90 | 14.26 | BUY | |
| 200 | 12.80 | BUY | 200 | 13.67 | BUY |
Keycorp
IPO: 1992-09-01
Ticker: KEYIndices: S&P 500,
Exchange: New York Stock Exchange, Inc. (US - USD)
Website: https://www.key.com
Phone:
Common Stock
Finance (
National Commercial Banks
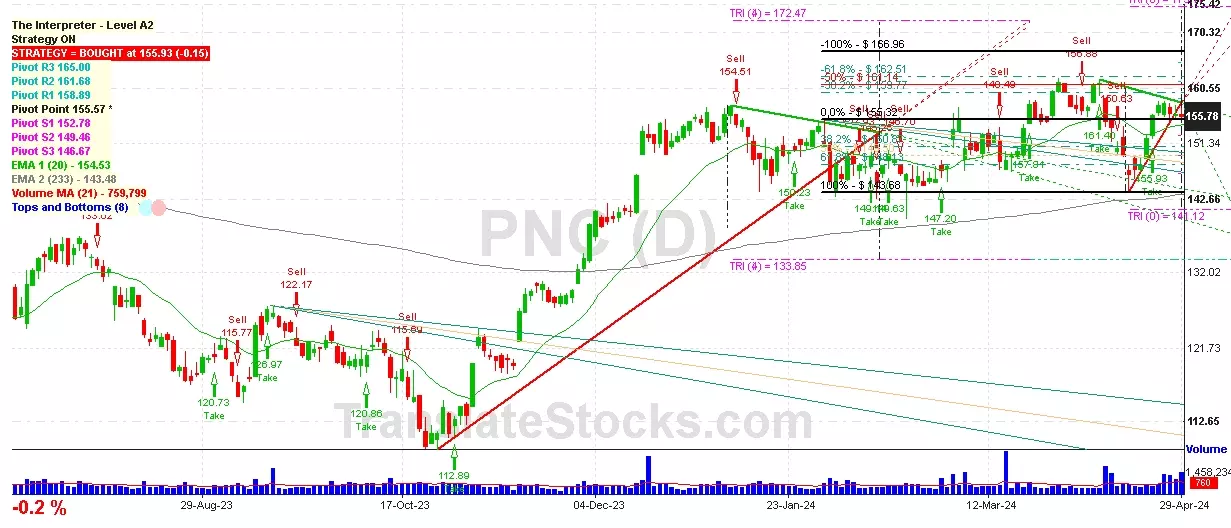
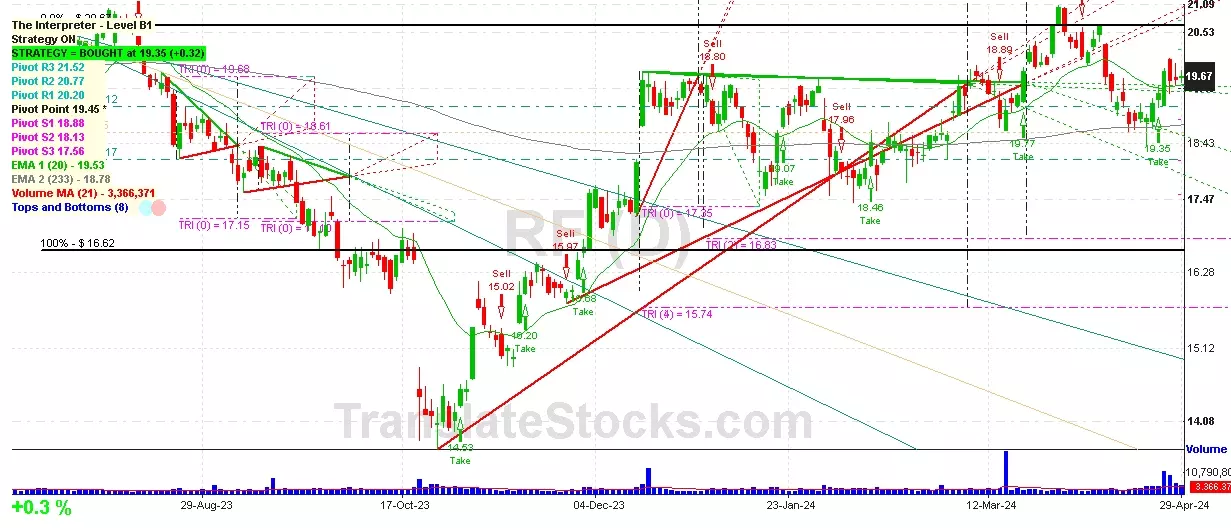
 Click to Enlarge
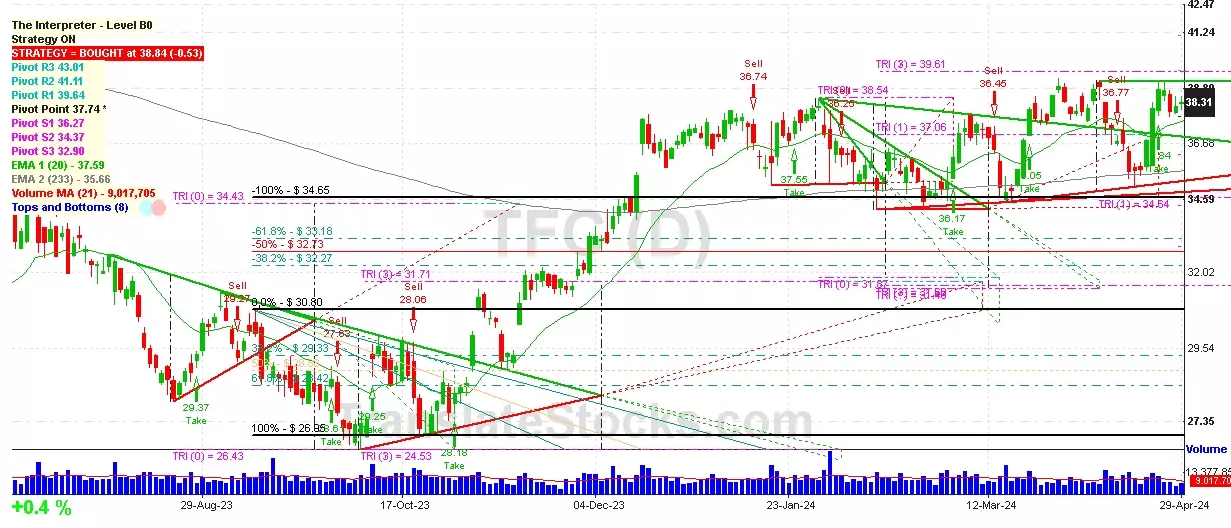
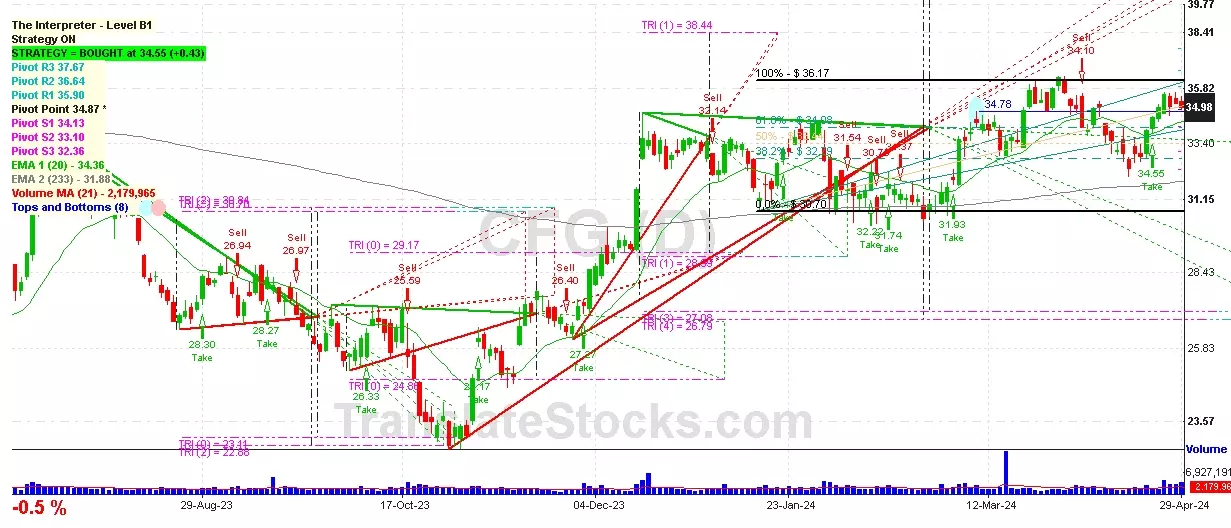