| Date | Price $ | Result % | Candle Name | Side |
|---|---|---|---|---|
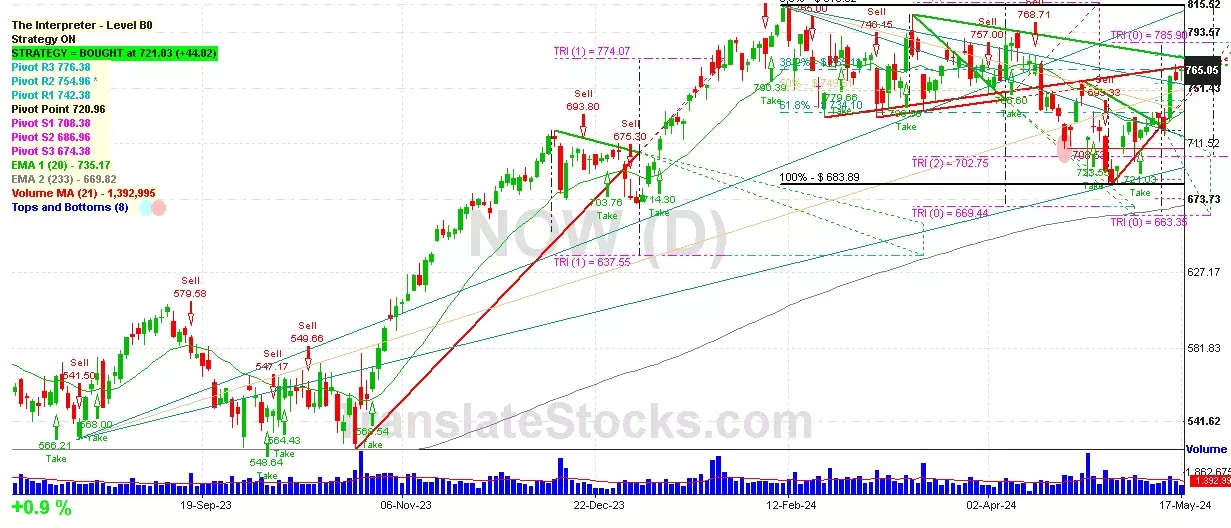
| 001 14 May 2024 | Sell Price: 721.62 | Loss: Close Day2 ($ 758.01) | Abandoned Baby | Sell |
| 002 25 Mar 2024 | Buy Price: 774.64 | Profit: Open Day1 ($ 778.99) | Piercing Line | Buy |
| 003 13 Oct 2023 | Sell Price: 549.66 | Loss: Close Day2 ($ 568.47) | Abandoned Baby | Sell |
| 004 31 May 2023 | Sell Price: 544.78 | Profit: Open Day1 ($ 534.80) | Abandoned Baby | Sell |
| 005One Year Average | Both Sides Result for 4 Signals |
Loss: $ -40.87 ($ -10.22 / Signal) |
All of Them | Buy + Sell |
| Simple Moving Averages (SMA) Period | Value $ | Signal | Exponential Moving Averages (EMA) Period | Value $ | Signal | |
|---|---|---|---|---|---|---|
| 2 | 761.53 | BUY | 2 | 761.64 | BUY | |
| 3 | 761.21 | BUY | 3 | 757.68 | BUY | |
| 5 | 747.07 | BUY | 5 | 750.58 | BUY | |
| 8 | 738.64 | BUY | 8 | 743.07 | BUY | |
| 13 | 726.69 | BUY | 13 | 736.90 | BUY | |
| 21 | 724.97 | BUY | 21 | 735.23 | BUY | |
| 34 | 738.44 | BUY | 34 | 738.00 | BUY | |
| 55 | 748.74 | BUY | 55 | 740.29 | BUY | |
| 90 | 755.32 | BUY | 90 | 732.68 | BUY | |
| 200 | 675.42 | BUY | 200 | 682.82 | BUY |
Servicenow Inc
IPO: 2012-06-29
Ticker: NOWIndices: S&P 500,
Exchange: New York Stock Exchange, Inc. (US - USD)
Website: https://www.servicenow.com/
Phone:
Common Stock
Technology (
Services-prepackaged Software
Year | 2021 | 2020 | 2019 | 2018 | 2017 | 2016 | 2015 | 2014 | 2013 | 2012 | 2011 | 2010 | |
|---|---|---|---|---|---|---|---|---|---|---|---|---|---|
| 1 | Assets + | 10,798 | 8,715 | 6,022 | 3,879 | 3,398 | 2,034 | 1,807 | 1,425 | 1,168 | 478 | 156 | 38 |
| 2 | Cash and Cash Equivalents + | 1,728 | 1,677 | 776 | 566 | 726 | 401 | 412 | 252 | 366 | 119 | 68 | 38 |
| 3 | Property + | 766 | 660 | 468 | 347 | 245 | 182 | 145 | 104 | 76 | 42 | 21 | 0 |
| 4 | Property + | 1,591 | 1,292 | 925 | 686 | 480 | 332 | 246 | 171 | 114 | 59 | 25 | 0 |
| 5 | Intangible Assets + | 287 | 153 | 144 | 101 | 87 | 66 | 43 | 55 | 6 | 1 | 0 | 0 |
| 6 | Finite-Lived Intangible Assets + | 287 | 153 | 144 | 101 | 87 | 66 | 43 | 55 | 6 | 1 | 0 | 0 |
| 7 | Liabilities and Equity + | 10,798 | 8,715 | 6,022 | 3,879 | 3,398 | 2,034 | 1,807 | 1,425 | 1,168 | 478 | 156 | 0 |
| 8 | Liabilities + | 7,103 | 5,881 | 3,894 | 2,768 | 2,814 | 1,647 | 1,240 | 996 | 774 | 235 | 146 | 0 |
| 9 | Temporary Equity + | 0 | 0 | 0 | 0 | 0 | 0 | 0 | 0 | 0 | 0 | 87 | 0 |
| 10 | Temporary Equity + | 0 | 0 | 0 | 0 | 0 | 0 | 0 | 0 | 0 | 0 | 68 | 0 |
| 11 | Temporary Equity + | 0 | 0 | 0 | 0 | 0 | 0 | 0 | 0 | 0 | 0 | 19 | 0 |
| 12 | Stockholders' Equity + | 3,695 | 2,834 | 2,128 | 1,111 | 584 | 387 | 567 | 429 | 394 | 243 | -57 | 0 |
| 13 | Stockholders' Equity Attributable to Parent + | 3,695 | 2,834 | 2,128 | 1,111 | 584 | 387 | 567 | 429 | 394 | 243 | -57 | 0 |
| 14 | Preferred Stock + | 0 | 0 | 0 | 0 | 0 | 0 | 0 | 0 | 0 | 0 | 0 | 0 |
| 15 | Common Stock + | 0 | 0 | 0 | 0 | 0 | 0 | 0 | 0 | 0 | 0 | 0 | 0 |
| 16 | Partners' Capital + | -4 | -234 | -352 | -979 | -1,147 | -997 | -557 | -359 | -179 | -105 | -68 | 0 |
| 17 | Partners' Capital + | -4 | -234 | -352 | -979 | -1,147 | -997 | -557 | -359 | -179 | -105 | -68 | 0 |
| 18 | Limited Liability Company (LLC) Members' Equity + | 30 | -140 | -327 | -983 | -1,148 | -1,018 | -574 | -371 | -179 | -105 | -67 | 0 |
| 19 | Limited Liability Company (LLC) Members' Equity + | 30 | -140 | -327 | -983 | -1,148 | -1,018 | -574 | -371 | -179 | -105 | -67 | 0 |
| 20 | Current Assets + | 5,220 | 4,522 | 2,827 | 2,345 | 2,411 | 1,343 | 1,086 | 907 | 798 | 422 | 131 | 0 |
| 21 | Cash + | 1,580 | 1,418 | 917 | 934 | 1,034 | 2 | 0 | 0 | 0 | 0 | 0 | 0 |
| 22 | Current Other Undisclosed Receivables | 0 | 0 | 0 | 0 | 0 | 0 | 831 | 705 | 0 | 0 | 0 | 0 |
| 23 | Current Receivables + | 1,390 | 1,009 | 835 | 575 | 435 | 323 | 1,034 | 864 | 108 | 78 | 45 | 0 |
| 24 | Current Prepaid Expense + | 0 | 0 | 0 | 0 | 0 | 0 | 0 | 0 | 0 | 7 | 4 | 0 |
| 25 | Current Contract with Customer + | 303 | 229 | 175 | 140 | 110 | 0 | 0 | 0 | 0 | 0 | 0 | 0 |
| 26 | Current Deferred Costs + | 0 | 0 | 0 | 0 | 119 | 77 | 52 | 43 | 31 | 15 | 6 | 0 |
| 27 | Long-Term Assets + | 2,272 | 1,468 | 1,237 | 243 | 179 | 120 | 78 | 63 | 13 | 2 | 1 | 0 |
| 28 | Long-term Investments and Receivables + | 99 | 28 | 22 | 15 | 6 | 11 | 0 | 0 | 0 | 0 | 0 | 0 |
| 29 | Long-Term Contract with Customer + | 623 | 444 | 333 | 282 | 224 | 0 | 0 | 0 | 0 | 0 | 0 | 0 |
| 30 | Current Liabilities + | 4,949 | 3,737 | 2,753 | 2,013 | 2,101 | 1,071 | 732 | 507 | 328 | 212 | 127 | 0 |
| 31 | Long-Term Other Undisclosed Liabilities | 63 | 46 | 40 | 38 | 40 | 34 | 10 | 12 | 14 | 16 | 13 | 0 |
| 32 | Long-Term Liabilities + | 2,154 | 2,144 | 1,141 | 755 | 713 | 576 | 508 | 489 | 446 | 23 | 19 | 0 |
| 33 | Current Other Assets + | 0 | 0 | 0 | 0 | 0 | 0 | 0 | 0 | 0 | 0 | 5 | 0 |
| 34 | Total Current Assets + | 5,220 | 4,522 | 2,827 | 2,345 | 2,411 | 1,343 | 1,086 | 907 | 798 | 422 | 131 | 0 |
| 35 | Operating Lease + | 591 | 454 | 402 | 0 | 0 | 0 | 0 | 0 | 0 | 0 | 0 | 0 |
| 36 | Goodwill + | 777 | 241 | 157 | 149 | 129 | 83 | 56 | 55 | 9 | 0 | 0 | 0 |
| 37 | Long-Term Other Assets + | 212 | 100 | 78 | 73 | 50 | 37 | 22 | 8 | 4 | 2 | 1 | 0 |
| 38 | Long-Term Deferred Costs + | 0 | 0 | 0 | 0 | 86 | 62 | 33 | 29 | 21 | 11 | 5 | 0 |
| 39 | Deferred Income Tax Assets + | 904 | 773 | 678 | 94 | 0 | 0 | 0 | 0 | 0 | 0 | 0 | 0 |
| 40 | Total Assets + | 10,798 | 8,715 | 6,022 | 3,879 | 3,398 | 2,034 | 1,807 | 1,425 | 1,168 | 478 | 156 | 0 |
| 41 | Total Liabilities + | 7,103 | 5,881 | 3,894 | 2,768 | 2,814 | 1,647 | 1,240 | 996 | 774 | 235 | 146 | 0 |
| 42 | Total Liabilities and Equity + | 10,798 | 8,715 | 6,022 | 3,879 | 3,398 | 2,034 | 1,807 | 1,425 | 1,168 | 478 | 156 | 0 |
Year | 2021 | 2020 | 2019 | 2018 | 2017 | 2016 | 2015 | 2014 | 2013 | 2012 | 2011 | 2010 | |
|---|---|---|---|---|---|---|---|---|---|---|---|---|---|
| 1 | 0 | 0 | 0 | 0 | 1,933 | 1,391 | 1,005 | 683 | 425 | 244 | 73 | 38 | |
| 2 | -1,353 | -987 | -797 | -623 | -500 | -399 | -329 | -249 | -155 | -104 | -28 | -13 | |
| 3 | 4,543 | 3,532 | 2,664 | 1,986 | 1,433 | 992 | 676 | 434 | 269 | 140 | 45 | 25 | |
| 4 | 1,397 | 1,024 | 748 | 530 | 378 | 285 | 217 | 148 | 79 | 39 | 7 | 3 | |
| 5 | 2,292 | 1,855 | 1,534 | 1,203 | 947 | 700 | 498 | 341 | 195 | 104 | 33 | 14 | |
| 6 | 597 | 454 | 339 | 296 | 211 | 159 | 127 | 96 | 62 | 34 | 10 | 3 | |
| 7 | 0 | 3 | 1 | 1 | 2 | 2 | 1 | 0 | 0 | 1 | 0 | 0 | |
| 8 | -4,286 | -3,334 | -2,622 | -2,029 | -1,535 | -1,415 | -842 | -586 | -336 | -177 | -50 | -20 | |
| 9 | 257 | 199 | 42 | -42 | -101 | -423 | -166 | -152 | -66 | -38 | -4 | 5 | |
| 10 | 0 | 0 | 0 | 0 | 0 | 0 | 0 | 3 | 1 | 0 | 0 | 0 | |
| 11 | 0 | 0 | 0 | 0 | 0 | 0 | 0 | 2 | -2 | 1 | 0 | 0 | |
| 12 | 20 | -17 | 58 | 56 | 0 | 0 | 0 | 0 | 0 | 0 | 0 | 0 | |
| 13 | 0 | 0 | 58 | 56 | 6 | 6 | 4 | -24 | -5 | 2 | -1 | 0 | |
| 14 | 28 | 33 | 33 | 53 | 53 | 33 | 31 | 29 | 3 | 0 | 0 | 0 | |
| 15 | 3 | 47 | 0 | 0 | 0 | 0 | 0 | 0 | 0 | 0 | 0 | 0 | |
| 16 | 0 | 149 | 67 | -39 | -149 | -450 | -193 | -176 | -71 | -36 | -6 | 5 | |
| 17 | 249 | 150 | 67 | 0 | 0 | 0 | 0 | 0 | 0 | 0 | 0 | 0 | |
| 18 | -19 | -31 | 560 | 12 | 0 | -2 | -5 | -4 | -3 | -1 | -1 | -1 | |
| 19 | Total Net Income (Loss) Attributable to Parent + | 230 | 119 | 627 | -27 | -149 | -452 | -198 | -179 | -74 | -37 | -7 | 5 |
| 20 | Temporary Equity + | 0 | 0 | 0 | 0 | 0 | 0 | 0 | 0 | 0 | 0 | 0 | 0 |
| 21 | 0 | 0 | 0 | 0 | 0 | 0 | -198 | -179 | -74 | -38 | -7 | 1 | |
| 22 | Total Earnings Per Share + | 1.16 | 0.61 | 3.36 | -0.15 | -0.68 | 0 | 0 | 0 | -0.54 | -0.51 | -0.33 | 0.04 |
| 23 | Total Earnings Per Share + | 1.13 | 0.59 | 3.18 | -0.15 | -0.68 | 0 | 0 | 0 | -0.54 | -0.51 | -0.33 | 0.04 |
| 24 | Total Earnings Per Share + | 0 | 0 | 0 | -0.15 | -0.87 | -2.75 | -1.27 | -1.23 | -0.54 | -0.51 | 0 | 0 |

 Click to Enlarge