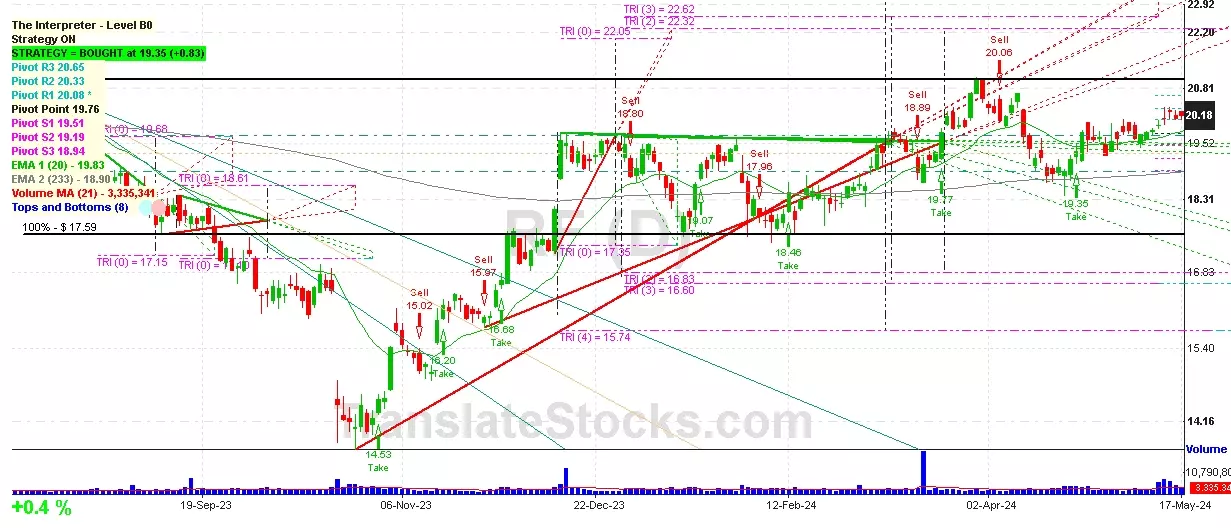
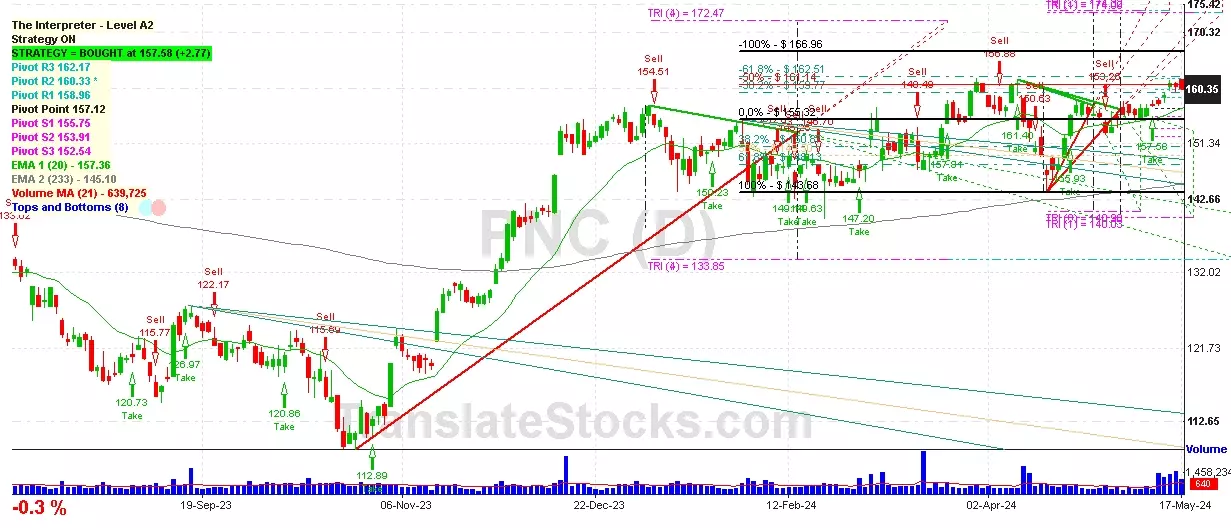
Hey Friend, I'm analysing PNC FINANCIAL SERVICES GROUP (PNC), and it is between the Support of $ 160.33 (PivotR2) and the Resistance of $ 161.14 (-50% of Fibonacci). The stock is also approaching the line of PivotR2 at $ 160.33, and if it goes below this line it could reach the next Support of -38.2% of Fibonacci at $ 159.77.

| Date | Price $ | Result % | Candle Name | Side |
|---|---|---|---|---|
| 001 17 Apr 2024 | Buy Price: 147.25 | Profit: Open Day1 ($ 147.36) | Abandoned Baby | Buy |
| 002 02 Jan 2024 | Buy Price: 156.50 | Loss: Close Day2 ($ 152.53) | Engulfing | Buy |
| 003 29 Dec 2023 | Sell Price: 154.85 | Profit: Open Day1 ($ 153.98) | Abandoned Baby | Sell |
| 004 13 Dec 2023 | Buy Price: 146.32 | Profit: Open Day1 ($ 149.65) | Engulfing | Buy |
| 005 24 Nov 2023 | Buy Price: 128.70 | Profit: Close Day1 ($ 128.85) | Engulfing | Buy |
| 006 14 Nov 2023 | Buy Price: 126.66 | Profit: Close Day1 ($ 128.96) | Abandoned Baby | Buy |
| 007 25 Jul 2023 | Sell Price: 133.54 | Profit: Close Day2 ($ 133.12) | Engulfing | Sell |
| 008 26 Jun 2023 | Buy Price: 123.73 | Profit: Close Day1 ($ 124.01) | Abandoned Baby | Buy |
| 009One Year Average | Both Sides Result for 8 Signals |
Profit: $ 3.49 ($ 0.44 / Signal) |
All of Them | Buy + Sell |
| Simple Moving Averages (SMA) Period | Value $ | Signal | Exponential Moving Averages (EMA) Period | Value $ | Signal | |
|---|---|---|---|---|---|---|
| 2 | 160.62 | SELL | 2 | 160.49 | SELL | |
| 3 | 160.86 | SELL | 3 | 160.38 | SELL | |
| 5 | 160.01 | BUY | 5 | 159.92 | BUY | |
| 8 | 158.99 | BUY | 8 | 159.20 | BUY | |
| 13 | 157.72 | BUY | 13 | 158.26 | BUY | |
| 21 | 156.94 | BUY | 21 | 157.26 | BUY | |
| 34 | 155.82 | BUY | 34 | 156.15 | BUY | |
| 55 | 154.87 | BUY | 55 | 154.56 | BUY | |
| 90 | 152.48 | BUY | 90 | 151.64 | BUY | |
| 200 | 139.29 | BUY | 200 | 145.48 | BUY |
Pnc Financial Services Group
IPO: 1987-10-21
Ticker: PNCIndices: S&P 500,
Exchange: New York Stock Exchange, Inc. (US - USD)
Website: https://www.pnc.com/
Phone:
Common Stock
Finance (
National Commercial Banks
 Click to Enlarge