| Date | Price $ | Result % | Candle Name | Side |
|---|---|---|---|---|
| 001 22 Apr 2024 | Buy Price: 19.18 | Profit: Open Day1 ($ 19.24) | Engulfing | Buy |
| 002 01 Apr 2024 | Sell Price: 20.56 | Profit: Open Day1 ($ 20.44) | Engulfing | Sell |
| 003 15 Mar 2024 | Buy Price: 19.05 | Profit: Open Day1 ($ 19.26) | Piercing Line | Buy |
| 004 01 Mar 2024 | Sell Price: 18.59 | Loss: Close Day2 ($ 19.49) | Abandoned Baby | Sell |
| 005 25 Jan 2024 | Sell Price: 19.13 | Profit: Open Day2 ($ 19.12) | Engulfing | Sell |
| 006 25 Jan 2024 | Sell Price: 19.15 | Profit: Open Day2 ($ 19.12) | Dark Cloud Cover | Sell |
| 007 18 Jan 2024 | Buy Price: 17.95 | Profit: Close Day1 ($ 18.62) | Abandoned Baby | Buy |
| 008 14 Nov 2023 | Buy Price: 15.92 | Profit: Open Day1 ($ 15.95) | Abandoned Baby | Buy |
| 009 26 Oct 2023 | Buy Price: 14.43 | Loss: Close Day2 ($ 14.22) | Abandoned Baby | Buy |
| 010 20 Sep 2023 | Sell Price: 17.81 | Profit: Open Day1 ($ 17.75) | Engulfing | Sell |
| 011 20 Sep 2023 | Sell Price: 17.84 | Profit: Open Day1 ($ 17.75) | Dark Cloud Cover | Sell |
| 012 05 Sep 2023 | Sell Price: 18.42 | Profit: Open Day1 ($ 18.25) | Engulfing | Sell |
| 013 13 Jun 2023 | Buy Price: 18.45 | Profit: Open Day1 ($ 18.60) | Engulfing | Buy |
| 014 31 May 2023 | Sell Price: 17.27 | Loss: Close Day2 ($ 18.06) | Abandoned Baby | Sell |
| 015 26 May 2023 | Buy Price: 17.78 | Profit: Open Day1 ($ 17.98) | Abandoned Baby | Buy |
| 016One Year Average | Both Sides Result for 15 Signals |
Loss: $ -0.11 ($ -0.01 / Signal) |
All of Them | Buy + Sell |
| Simple Moving Averages (SMA) Period | Value $ | Signal | Exponential Moving Averages (EMA) Period | Value $ | Signal | |
|---|---|---|---|---|---|---|
| 2 | 19.42 | BUY | 2 | 19.51 | BUY | |
| 3 | 19.50 | BUY | 3 | 19.51 | BUY | |
| 5 | 19.55 | BUY | 5 | 19.50 | BUY | |
| 8 | 19.51 | BUY | 8 | 19.48 | BUY | |
| 13 | 19.29 | BUY | 13 | 19.48 | BUY | |
| 21 | 19.55 | BUY | 21 | 19.51 | BUY | |
| 34 | 19.69 | SELL | 34 | 19.48 | BUY | |
| 55 | 19.34 | BUY | 55 | 19.32 | BUY | |
| 90 | 19.13 | BUY | 90 | 19.03 | BUY | |
| 200 | 18.29 | BUY | 200 | 18.74 | BUY |
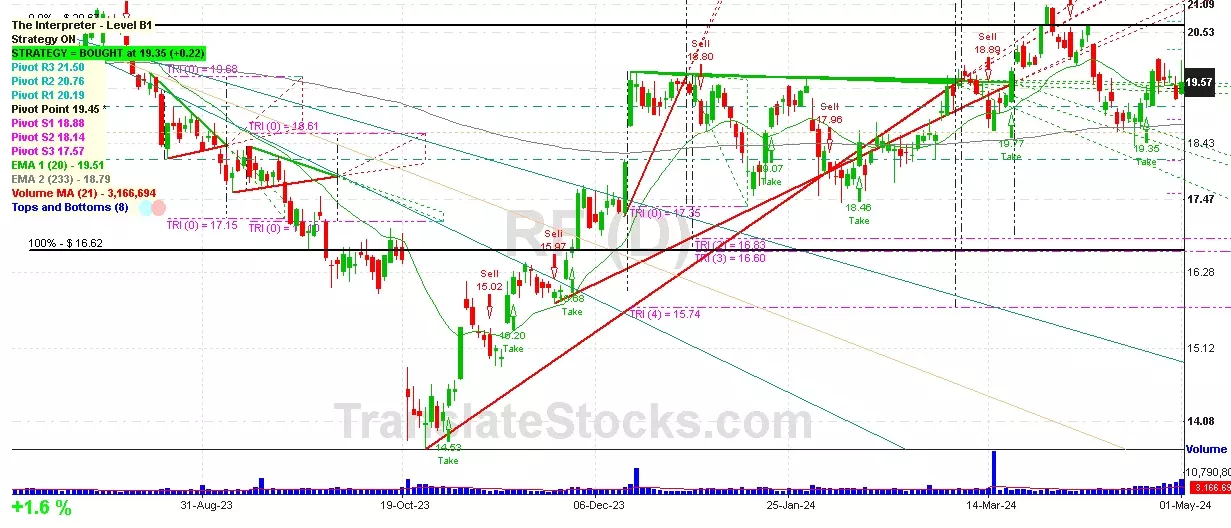
Regions Financial Corp
IPO: 2002-05-03
Ticker: RFIndices: S&P 500,
Exchange: New York Stock Exchange, Inc. (US - USD)
Website: https://www.regions.com/
Phone:
Common Stock
Finance (
National Commercial Banks

 Click to Enlarge