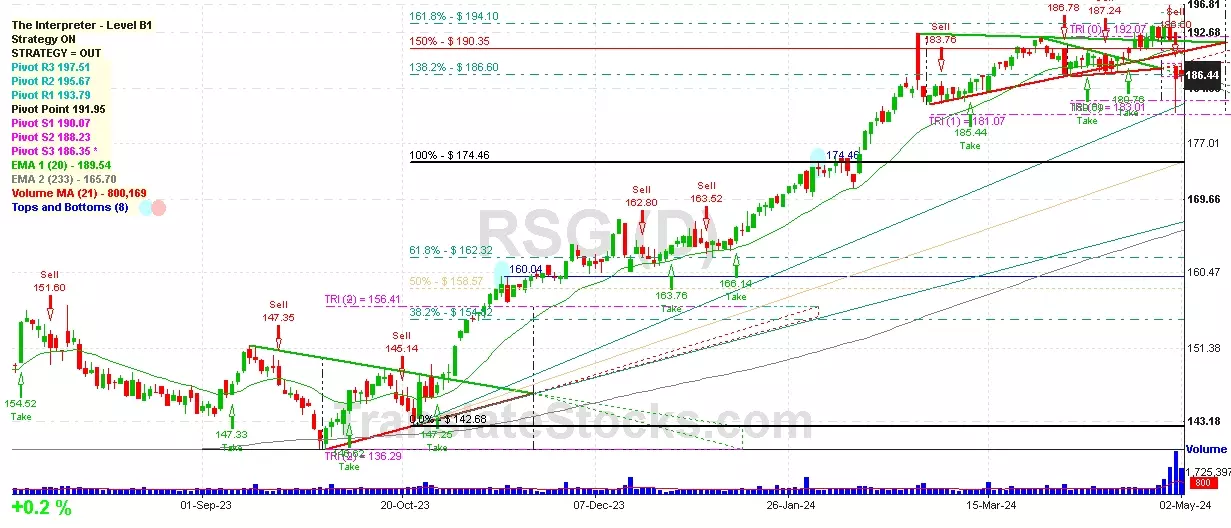
Hey Friend, I'm analysing REPUBLIC SERVICES INC (RSG), and it is between the Support of $ 186.35 (PivotS3) and the Resistance of $ 186.60 (138.2% of Fibonacci). The stock is also approaching the line of PivotS3 at $ 186.35, and if it goes below this line it could reach the next Support of Triangle projection at $183.01.

| Date | Price $ | Result % | Candle Name | Side |
|---|---|---|---|---|
| 001 20 Feb 2024 | Sell Price: 180.01 | Loss: Close Day2 ($ 183.33) | Engulfing | Sell |
| 002 13 Feb 2024 | Buy Price: 175.61 | Profit: Open Day1 ($ 176.32) | Abandoned Baby | Buy |
| 003 03 Jan 2024 | Sell Price: 163.72 | Profit: Close Day2 ($ 163.52) | Dark Cloud Cover | Sell |
| 004 19 Dec 2023 | Sell Price: 162.80 | Profit: Open Day1 ($ 162.39) | Engulfing | Sell |
| 005 03 Oct 2023 | Buy Price: 142.50 | Profit: Open Day1 ($ 142.69) | Engulfing | Buy |
| 006 03 Oct 2023 | Buy Price: 142.36 | Profit: Open Day1 ($ 142.69) | Piercing Line | Buy |
| 007 10 Jul 2023 | Buy Price: 150.89 | Profit: Open Day2 ($ 150.99) | Abandoned Baby | Buy |
| 008One Year Average | Both Sides Result for 7 Signals |
Loss: $ -1.38 ($ -0.20 / Signal) |
All of Them | Buy + Sell |
| Simple Moving Averages (SMA) Period | Value $ | Signal | Exponential Moving Averages (EMA) Period | Value $ | Signal | |
|---|---|---|---|---|---|---|
| 2 | 186.22 | BUY | 2 | 186.98 | SELL | |
| 3 | 188.05 | SELL | 3 | 187.78 | SELL | |
| 5 | 189.89 | SELL | 5 | 188.86 | SELL | |
| 8 | 190.70 | SELL | 8 | 189.53 | SELL | |
| 13 | 190.20 | SELL | 13 | 189.75 | SELL | |
| 21 | 189.48 | SELL | 21 | 189.48 | SELL | |
| 34 | 189.38 | SELL | 34 | 188.32 | SELL | |
| 55 | 187.14 | SELL | 55 | 185.53 | BUY | |
| 90 | 179.87 | BUY | 90 | 180.46 | BUY | |
| 200 | 164.23 | BUY | 200 | 168.31 | BUY |
Republic Services Inc
IPO: 1998-07-01
Ticker: RSGIndices: S&P 500,
Exchange: New York Stock Exchange, Inc. (US - USD)
Website: http://www.republicservices.com/
Phone:
Common Stock
Energy & Transportation (
Refuse Systems
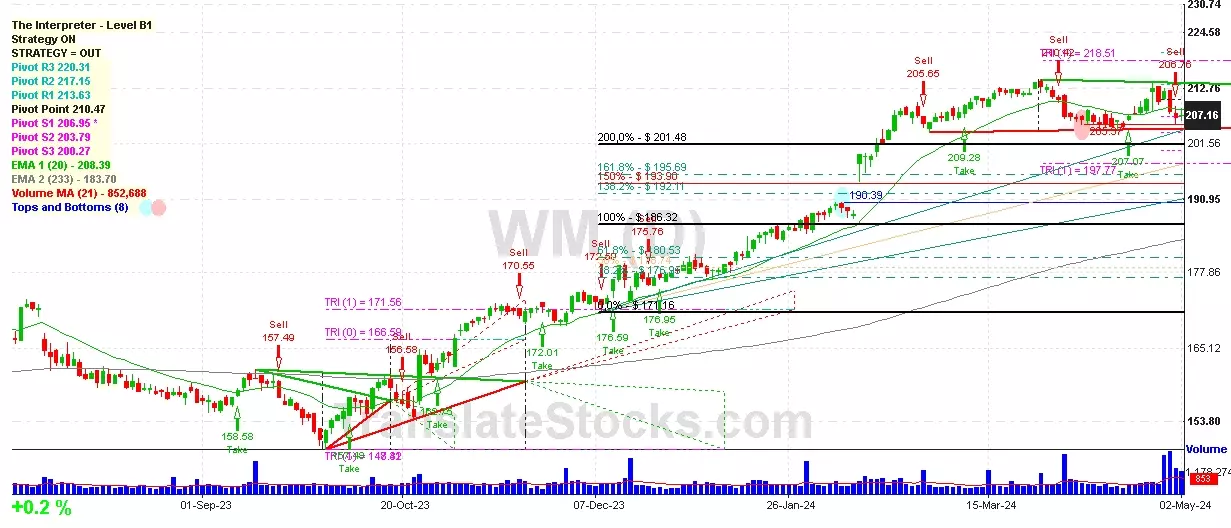
 Click to Enlarge
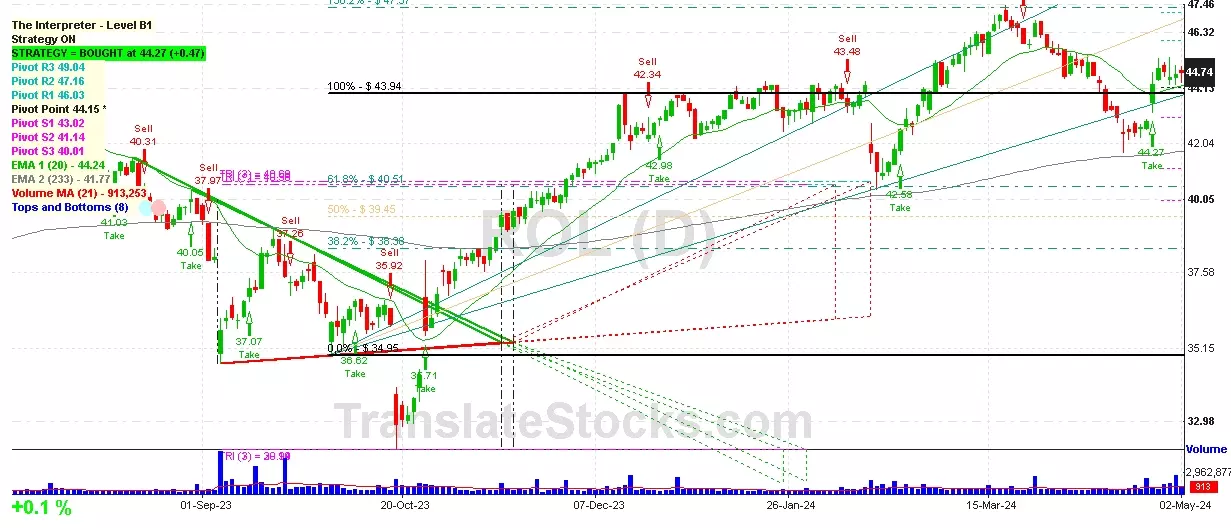