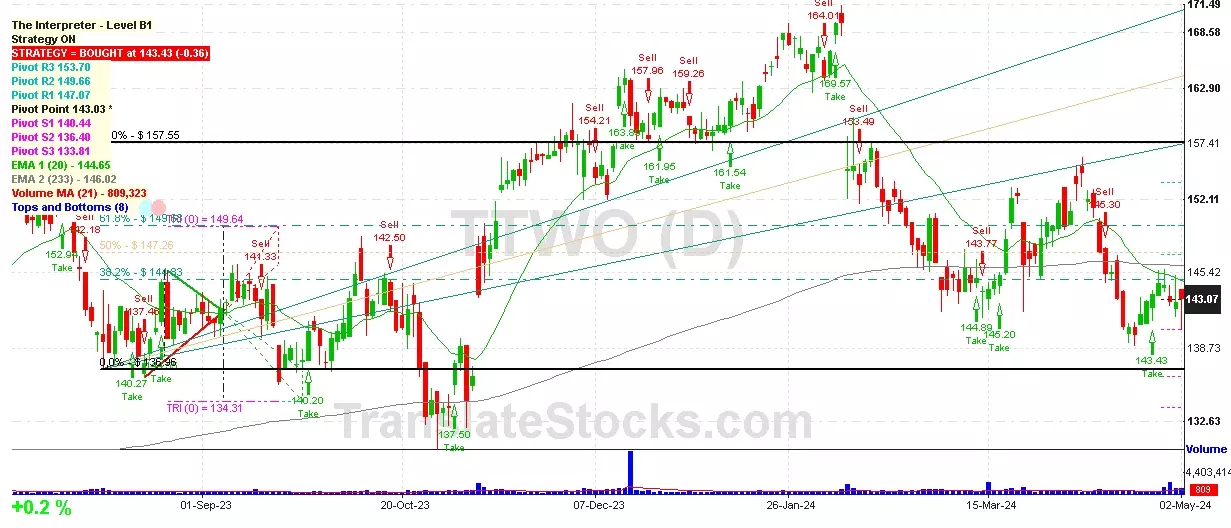
Hey Friend, I'm analysing TAKE TWO INTERACTIVE SOFTWRE (TTWO), and it is between the Support of $ 143.03 (Pivot) and the Resistance of $ 144.73 (38.2% of Fibonacci). The stock is also approaching the line of Pivot at $ 143.03, and if it goes below this line it could reach the next Support of 0% of Fibonacci at $ 136.96.

| Date | Price $ | Result % | Candle Name | Side |
|---|---|---|---|---|
| 001 01 Feb 2024 | Buy Price: 166.33 | Profit: Open Day1 ($ 166.53) | Engulfing | Buy |
| 002 04 Jan 2024 | Buy Price: 158.86 | Loss: Close Day2 ($ 158.54) | Piercing Line | Buy |
| 003 29 Dec 2023 | Sell Price: 160.95 | Profit: Open Day1 ($ 160.14) | Engulfing | Sell |
| 004 29 Dec 2023 | Sell Price: 160.92 | Profit: Open Day1 ($ 160.14) | Dark Cloud Cover | Sell |
| 005 21 Dec 2023 | Buy Price: 160.39 | Profit: Close Day1 ($ 161.95) | Abandoned Baby | Buy |
| 006 04 Oct 2023 | Buy Price: 139.63 | Profit: Close Day1 ($ 140.20) | Abandoned Baby | Buy |
| 007 20 Sep 2023 | Sell Price: 140.72 | Profit: Open Day1 ($ 139.00) | Engulfing | Sell |
| 008 07 Sep 2023 | Buy Price: 142.23 | Profit: Open Day1 ($ 142.75) | Engulfing | Buy |
| 009 02 Jun 2023 | Sell Price: 137.52 | Profit: Open Day1 ($ 136.85) | Dark Cloud Cover | Sell |
| 010 19 May 2023 | Sell Price: 137.43 | Profit: Close Day1 ($ 137.25) | Engulfing | Sell |
| 011 19 May 2023 | Sell Price: 137.57 | Profit: Open Day1 ($ 137.43) | Dark Cloud Cover | Sell |
| 012 12 May 2023 | Sell Price: 125.26 | Profit: Close Day1 ($ 125.07) | Dark Cloud Cover | Sell |
| 013One Year Average | Both Sides Result for 12 Signals |
Profit: $ 7.01 ($ 0.58 / Signal) |
All of Them | Buy + Sell |
| Simple Moving Averages (SMA) Period | Value $ | Signal | Exponential Moving Averages (EMA) Period | Value $ | Signal | |
|---|---|---|---|---|---|---|
| 2 | 142.91 | BUY | 2 | 143.02 | BUY | |
| 3 | 142.87 | BUY | 3 | 143.06 | BUY | |
| 5 | 143.47 | SELL | 5 | 143.11 | SELL | |
| 8 | 143.17 | SELL | 8 | 143.25 | SELL | |
| 13 | 142.70 | BUY | 13 | 143.80 | SELL | |
| 21 | 145.72 | SELL | 21 | 144.76 | SELL | |
| 34 | 146.66 | SELL | 34 | 146.17 | SELL | |
| 55 | 147.33 | SELL | 55 | 147.98 | SELL | |
| 90 | 153.21 | SELL | 90 | 149.32 | SELL | |
| 200 | 149.10 | SELL | 200 | 146.96 | SELL |
Take-two Interactive Softwre
IPO: 1997-04-15
Ticker: TTWOIndices: S&P 500,
Exchange: Nasdaq Nms - Global Market (US - USD)
Website: http://www.take2games.com
Phone:
Common Stock
Technology (
Services-prepackaged Software
 Click to Enlarge