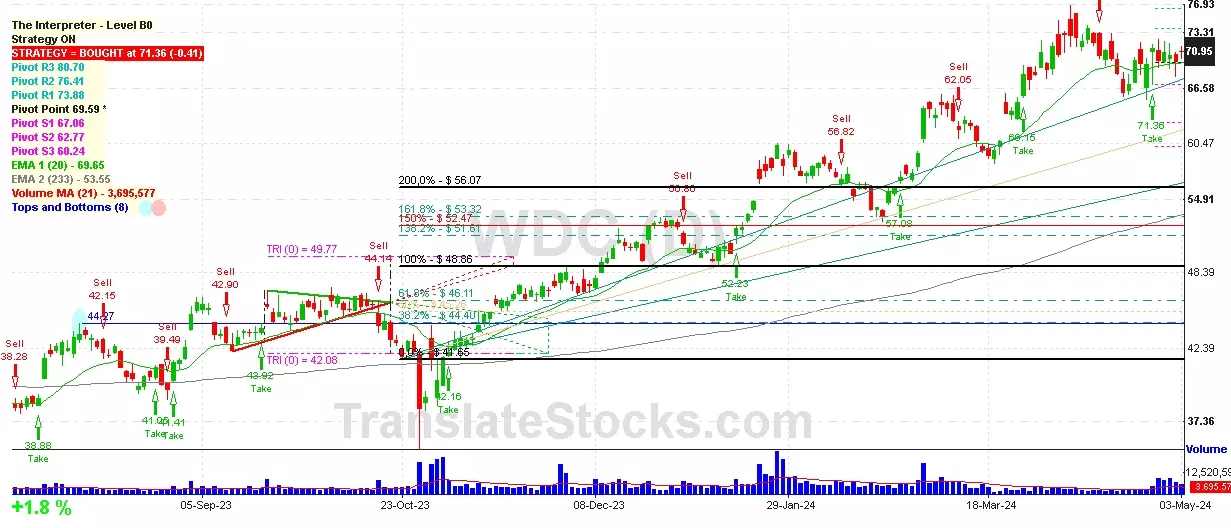
Hey Friend, I'm analysing WESTERN DIGITAL CORP (WDC), and it is between the Support of $ 69.59 (Pivot) and the Resistance of $ 73.88 (PivotR1). The stock is also approaching the line of Pivot at $ 69.59, and if it goes below this line it could reach the next Support of 200% of Fibonacci at $ 56.07.

| Date | Price $ | Result % | Candle Name | Side |
|---|---|---|---|---|
| 001 04 Apr 2024 | Sell Price: 70.54 | Loss: Close Day2 ($ 72.95) | Dark Cloud Cover | Sell |
| 002 05 Mar 2024 | Sell Price: 63.49 | Loss: Close Day2 ($ 64.28) | Abandoned Baby | Sell |
| 003 28 Feb 2024 | Sell Price: 57.46 | Loss: Close Day2 ($ 64.30) | Abandoned Baby | Sell |
| 004 22 Feb 2024 | Buy Price: 55.70 | Profit: Close Day1 ($ 56.06) | Abandoned Baby | Buy |
| 005 15 Feb 2024 | Sell Price: 56.01 | Profit: Close Day1 ($ 54.00) | Dark Cloud Cover | Sell |
| 006 31 May 2023 | Sell Price: 38.73 | Profit: Open Day1 ($ 38.51) | Abandoned Baby | Sell |
| 007One Year Average | Both Sides Result for 6 Signals |
Loss: $ -7.45 ($ -1.24 / Signal) |
All of Them | Buy + Sell |
| Simple Moving Averages (SMA) Period | Value $ | Signal | Exponential Moving Averages (EMA) Period | Value $ | Signal | |
|---|---|---|---|---|---|---|
| 2 | 70.34 | BUY | 2 | 70.63 | BUY | |
| 3 | 70.39 | BUY | 3 | 70.53 | BUY | |
| 5 | 70.37 | BUY | 5 | 70.39 | BUY | |
| 8 | 70.28 | BUY | 8 | 70.24 | BUY | |
| 13 | 69.52 | BUY | 13 | 70.07 | BUY | |
| 21 | 70.58 | BUY | 21 | 69.57 | BUY | |
| 34 | 68.84 | BUY | 34 | 68.25 | BUY | |
| 55 | 65.34 | BUY | 55 | 65.82 | BUY | |
| 90 | 61.20 | BUY | 90 | 62.17 | BUY | |
| 200 | 51.91 | BUY | 200 | 54.84 | BUY |
Western Digital Corp
IPO: 1991-01-31
Ticker: WDCIndices: S&P 500,
Exchange: Nasdaq Nms - Global Market (US - USD)
Website: https://www.westerndigital.com/
Phone:
Common Stock
Technology (
Computer Storage Devices
 Click to Enlarge