| Date | Price $ | Result % | Candle Name | Side |
|---|---|---|---|---|
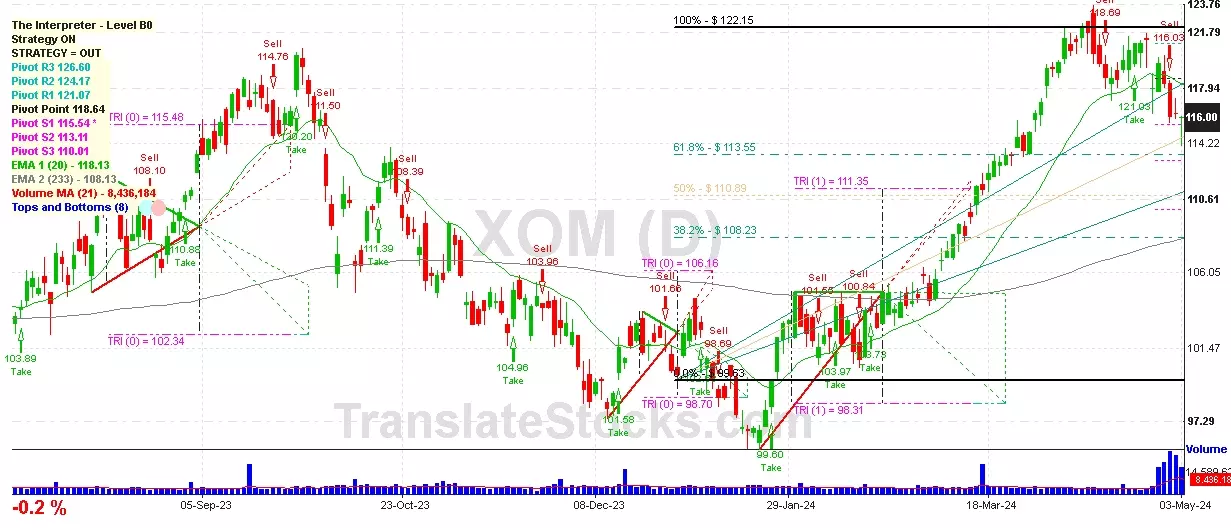
| 001 29 Apr 2024 | Buy Price: 119.64 | Loss: Close Day2 ($ 116.03) | Engulfing | Buy |
| 002 11 Apr 2024 | Sell Price: 121.79 | Profit: Close Day1 ($ 120.37) | Dark Cloud Cover | Sell |
| 003 26 Feb 2024 | Buy Price: 104.25 | Profit: Open Day1 ($ 104.68) | Engulfing | Buy |
| 004 06 Feb 2024 | Buy Price: 102.25 | Profit: Open Day2 ($ 102.34) | Abandoned Baby | Buy |
| 005 19 Jan 2024 | Buy Price: 96.99 | Profit: Close Day2 ($ 97.91) | Engulfing | Buy |
| 006 19 Jan 2024 | Buy Price: 96.95 | Profit: Close Day2 ($ 97.91) | Piercing Line | Buy |
| 007 24 Nov 2023 | Buy Price: 104.57 | Loss: Close Day2 ($ 103.90) | Abandoned Baby | Buy |
| 008 01 Jun 2023 | Buy Price: 103.36 | Profit: Open Day1 ($ 105.16) | Engulfing | Buy |
| 009One Year Average | Both Sides Result for 8 Signals |
Profit: $ 1.35 ($ 0.17 / Signal) |
All of Them | Buy + Sell |
| Simple Moving Averages (SMA) Period | Value $ | Signal | Exponential Moving Averages (EMA) Period | Value $ | Signal | |
|---|---|---|---|---|---|---|
| 2 | 116.12 | SELL | 2 | 116.15 | SELL | |
| 3 | 116.09 | SELL | 3 | 116.43 | SELL | |
| 5 | 117.24 | SELL | 5 | 117.03 | SELL | |
| 8 | 118.32 | SELL | 8 | 117.69 | SELL | |
| 13 | 118.86 | SELL | 13 | 118.22 | SELL | |
| 21 | 119.57 | SELL | 21 | 118.07 | SELL | |
| 34 | 117.98 | SELL | 34 | 116.75 | SELL | |
| 55 | 113.45 | BUY | 55 | 114.37 | BUY | |
| 90 | 108.58 | BUY | 90 | 111.78 | BUY | |
| 200 | 108.27 | BUY | 200 | 108.82 | BUY |
Exxon Mobil Corp
IPO: 1980-03-17
Ticker: XOMIndices: S&P 500,
Exchange: New York Stock Exchange, Inc. (US - USD)
Website: http://corporate.exxonmobil.com/
Phone:
Common Stock
Energy & Transportation (
Petroleum Refining

 Click to Enlarge