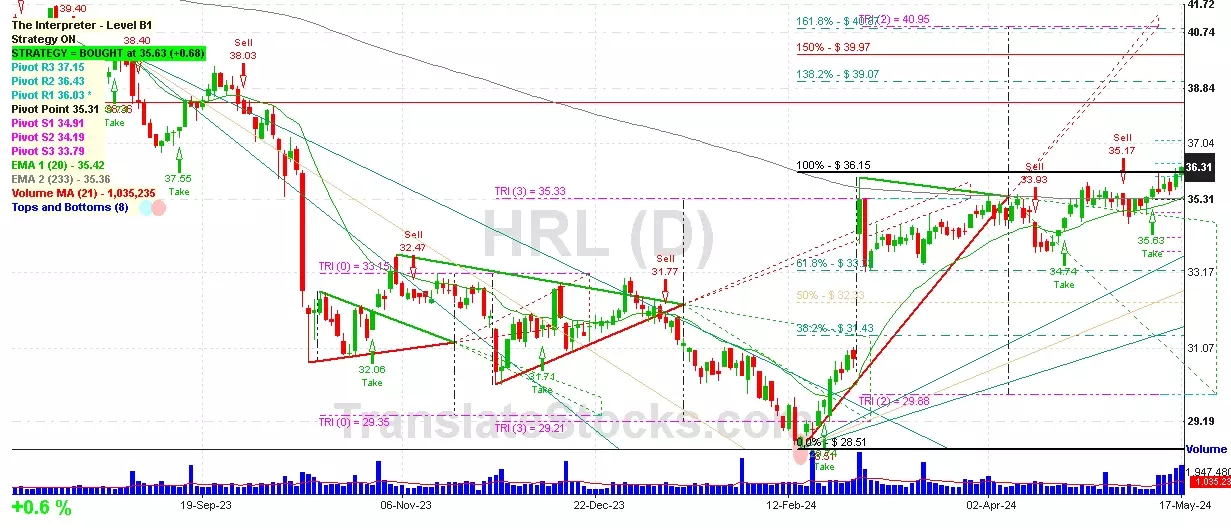
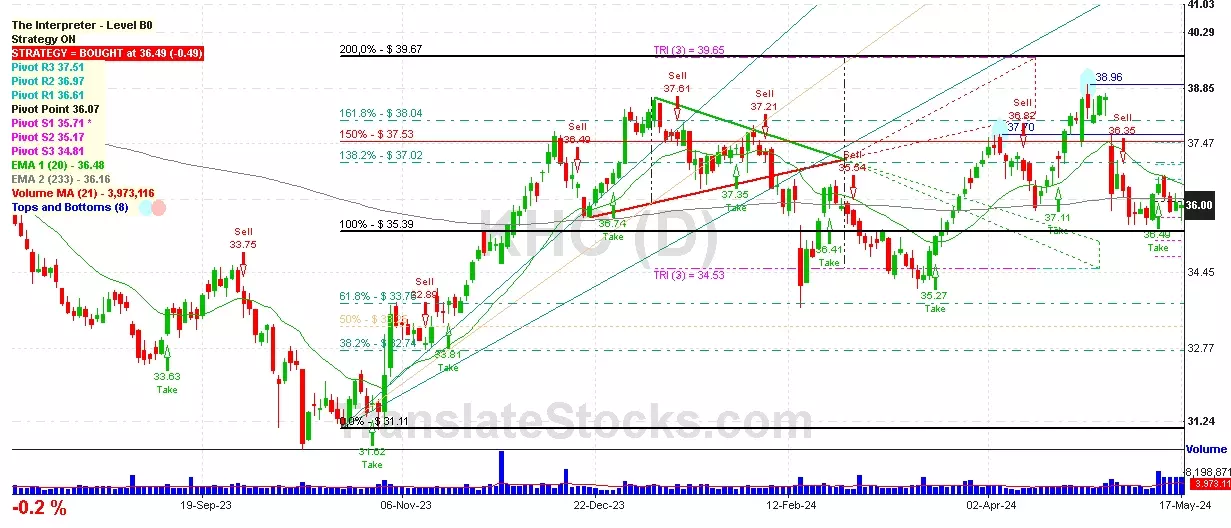
Hey Friend, I'm analysing KRAFT HEINZ CO/THE (KHC), and it is between the Support of $ 35.71 (PivotS1) and the Resistance of $ 36.07 (Pivot). The stock is also approaching the line of Pivot at $ 36.07, and if it goes above this line it could reach the next Resistance of 138.2% of Fibonacci at $ 37.02.

| Date | Price $ | Result % | Candle Name | Side |
|---|---|---|---|---|
| 001 09 May 2024 | Sell Price: 35.71 | Profit: Open Day1 ($ 35.67) | Engulfing | Sell |
| 002 23 Feb 2024 | Sell Price: 36.05 | Profit: Open Day1 ($ 35.90) | Engulfing | Sell |
| 003 08 Dec 2023 | Sell Price: 36.23 | Loss: Close Day2 ($ 37.26) | Engulfing | Sell |
| 004 27 Nov 2023 | Sell Price: 34.89 | Loss: Close Day2 ($ 35.08) | Dark Cloud Cover | Sell |
| 005 20 Nov 2023 | Buy Price: 33.79 | Profit: Open Day1 ($ 33.91) | Piercing Line | Buy |
| 006 01 Nov 2023 | Buy Price: 32.20 | Profit: Open Day1 ($ 32.38) | Engulfing | Buy |
| 007 19 Oct 2023 | Sell Price: 31.45 | Profit: Close Day1 ($ 31.31) | Engulfing | Sell |
| 008 21 Aug 2023 | Sell Price: 33.48 | Profit: Open Day1 ($ 33.41) | Engulfing | Sell |
| 009 08 Jun 2023 | Buy Price: 37.19 | Loss: Close Day2 ($ 36.58) | Engulfing | Buy |
| 010 08 Jun 2023 | Buy Price: 37.19 | Loss: Close Day2 ($ 36.58) | Piercing Line | Buy |
| 011 26 May 2023 | Buy Price: 38.34 | Loss: Close Day2 ($ 38.22) | Abandoned Baby | Buy |
| 012One Year Average | Both Sides Result for 11 Signals |
Loss: $ -1.86 ($ -0.17 / Signal) |
All of Them | Buy + Sell |
| Simple Moving Averages (SMA) Period | Value $ | Signal | Exponential Moving Averages (EMA) Period | Value $ | Signal | |
|---|---|---|---|---|---|---|
| 2 | 36.04 | SELL | 2 | 36.01 | SELL | |
| 3 | 35.97 | BUY | 3 | 36.03 | SELL | |
| 5 | 36.12 | SELL | 5 | 36.06 | SELL | |
| 8 | 36.06 | SELL | 8 | 36.14 | SELL | |
| 13 | 36.10 | SELL | 13 | 36.31 | SELL | |
| 21 | 36.94 | SELL | 21 | 36.49 | SELL | |
| 34 | 36.92 | SELL | 34 | 36.55 | SELL | |
| 55 | 36.33 | SELL | 55 | 36.50 | SELL | |
| 90 | 36.44 | SELL | 90 | 36.32 | SELL | |
| 200 | 35.18 | BUY | 200 | 36.13 | SELL |
Kraft Heinz Co/the
IPO: 2015-07-06
Ticker: KHCIndices: S&P 500,
Nasdaq 100,
Exchange: Nasdaq Nms - Global Market (US - USD)
Website: https://www.kraftheinzcompany.com/
Phone:
Common Stock
Manufacturing (
Canned, Frozen & Preservd Fruit, Veg & Food Specialties
 Click to Enlarge