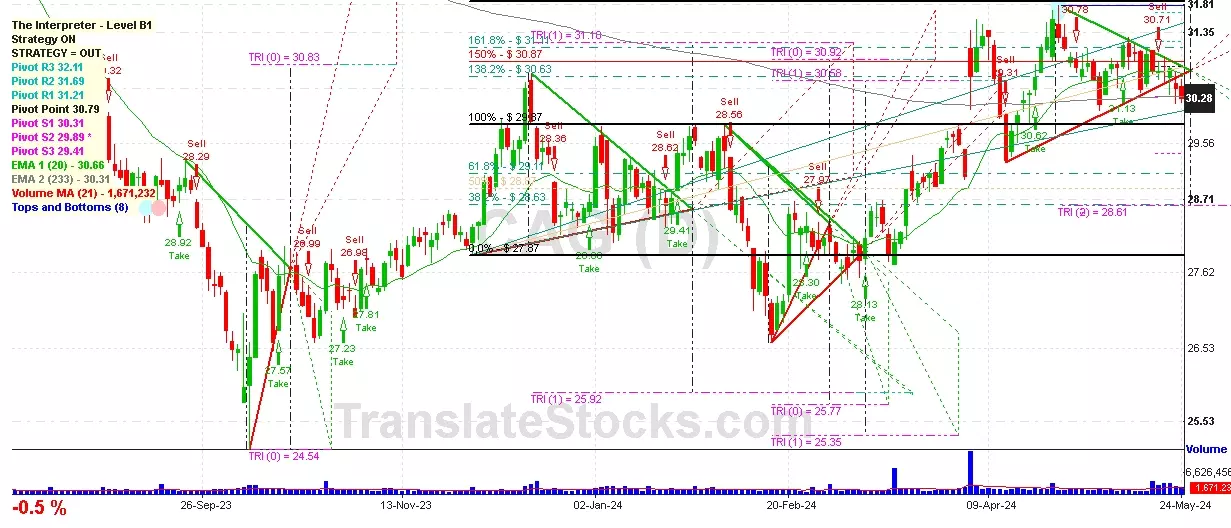
| Date | Price $ | Result % | Candle Name | Side |
|---|---|---|---|---|
| 001 08 May 2024 | Sell Price: 83.16 | Loss: Close Day2 ($ 85.16) | Engulfing | Sell |
| 002 06 May 2024 | Sell Price: 84.41 | Profit: Close Day2 ($ 83.16) | Engulfing | Sell |
| 003 01 Apr 2024 | Sell Price: 104.98 | Profit: Open Day1 ($ 104.84) | Abandoned Baby | Sell |
| 004 10 Oct 2023 | Buy Price: 96.37 | Loss: Close Day2 ($ 84.10) | Engulfing | Buy |
| 005 24 Aug 2023 | Sell Price: 95.71 | Loss: Close Day2 ($ 96.41) | Engulfing | Sell |
| 006One Year Average | Both Sides Result for 5 Signals |
Loss: $ -13.58 ($ -2.72 / Signal) |
All of Them | Buy + Sell |
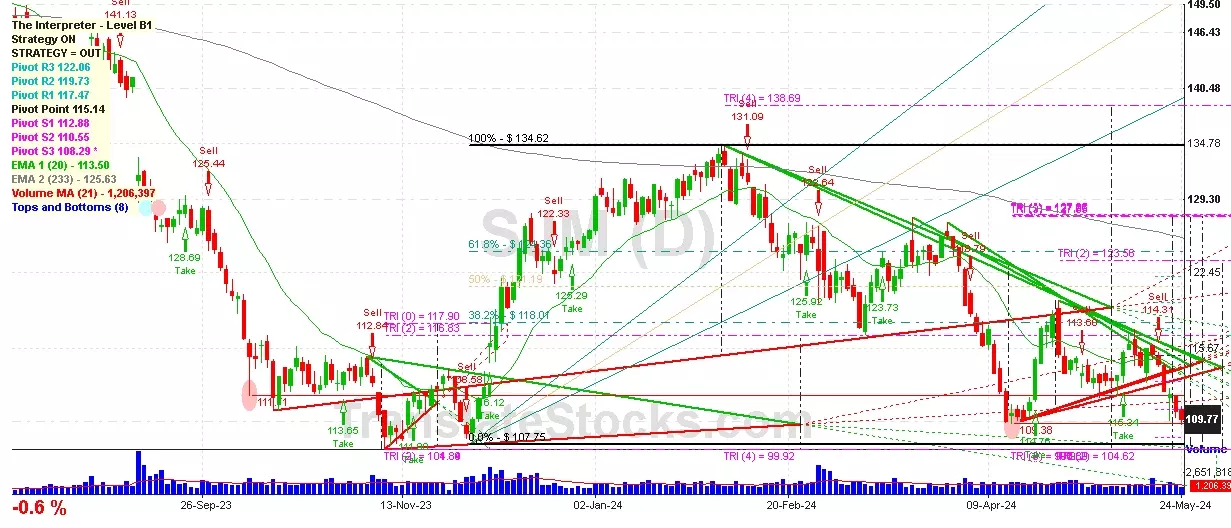
| Simple Moving Averages (SMA) Period | Value $ | Signal | Exponential Moving Averages (EMA) Period | Value $ | Signal | |
|---|---|---|---|---|---|---|
| 2 | 88.48 | BUY | 2 | 88.77 | BUY | |
| 3 | 88.57 | BUY | 3 | 88.50 | BUY | |
| 5 | 87.92 | BUY | 5 | 88.05 | BUY | |
| 8 | 87.43 | BUY | 8 | 87.49 | BUY | |
| 13 | 86.33 | BUY | 13 | 86.79 | BUY | |
| 21 | 85.50 | BUY | 21 | 86.42 | BUY | |
| 34 | 83.95 | BUY | 34 | 87.21 | BUY | |
| 55 | 90.05 | SELL | 55 | 89.41 | SELL | |
| 90 | 95.27 | SELL | 90 | 92.28 | SELL | |
| 200 | 96.43 | SELL | 200 | 95.72 | SELL |
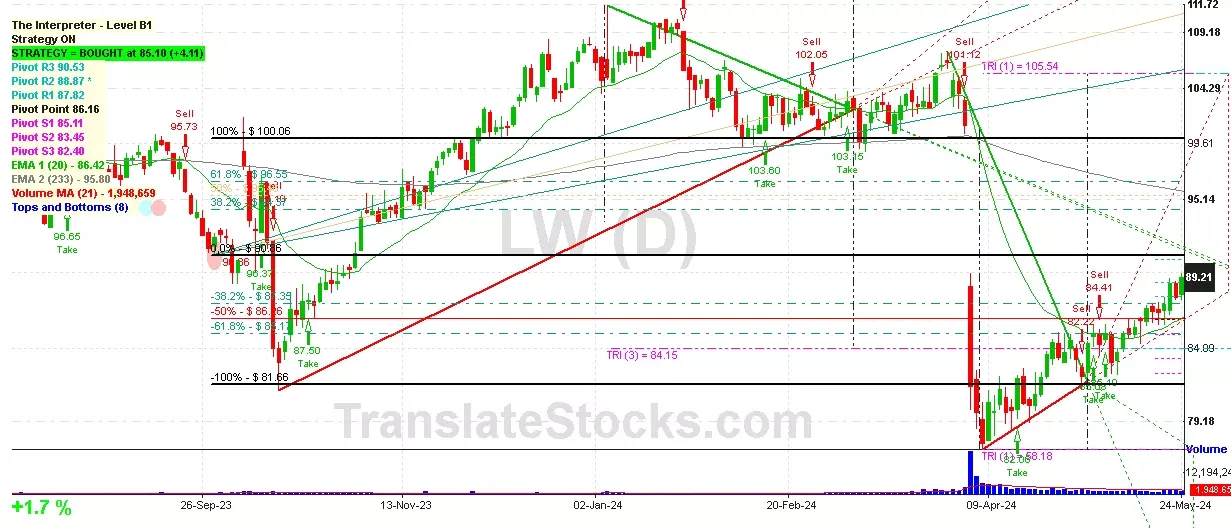
Lamb Weston Holdings Inc
IPO: 2016-10-31
Ticker: LWIndices: S&P 500,
Exchange: New York Stock Exchange, Inc. (US - USD)
Website: https://www.lambweston.com/
Phone:
Common Stock
Manufacturing (
Canned, Frozen & Preservd Fruit, Veg & Food Specialties

 Click to Enlarge