| Date | Price $ | Result % | Candle Name | Side |
|---|---|---|---|---|
| 001 28 Nov 2023 | Sell Price: 11.30 | Loss: Close Day2 ($ 11.32) | Engulfing | Sell |
| 002 15 Aug 2023 | Buy Price: 23.26 | Loss: Close Day2 ($ 22.44) | Engulfing | Buy |
| 003 18 Jul 2023 | Buy Price: 20.53 | Profit: Open Day1 ($ 20.65) | Engulfing | Buy |
| 004 12 Jul 2023 | Sell Price: 20.23 | Loss: Close Day2 ($ 20.52) | Engulfing | Sell |
| 005 12 Jul 2023 | Sell Price: 20.27 | Loss: Close Day2 ($ 20.52) | Dark Cloud Cover | Sell |
| 006 08 Jun 2023 | Sell Price: 20.01 | Profit: Open Day1 ($ 19.94) | Engulfing | Sell |
| 007 31 May 2023 | Buy Price: 19.39 | Profit: Open Day1 ($ 19.52) | Engulfing | Buy |
| 008 31 May 2023 | Buy Price: 19.36 | Profit: Open Day1 ($ 19.52) | Piercing Line | Buy |
| 009One Year Average | Both Sides Result for 8 Signals |
Loss: $ -0.91 ($ -0.11 / Signal) |
All of Them | Buy + Sell |
| Simple Moving Averages (SMA) Period | Value $ | Signal | Exponential Moving Averages (EMA) Period | Value $ | Signal | |
|---|---|---|---|---|---|---|
| 2 | 21.66 | BUY | 2 | 21.70 | BUY | |
| 3 | 21.66 | BUY | 3 | 21.61 | BUY | |
| 5 | 21.45 | BUY | 5 | 21.41 | BUY | |
| 8 | 21.07 | BUY | 8 | 21.11 | BUY | |
| 13 | 20.58 | BUY | 13 | 20.65 | BUY | |
| 21 | 19.77 | BUY | 21 | 20.11 | BUY | |
| 34 | 19.08 | BUY | 34 | 19.52 | BUY | |
| 55 | 18.72 | BUY | 55 | 18.87 | BUY | |
| 90 | 18.04 | BUY | 90 | 18.20 | BUY | |
| 200 | 17.11 | BUY | 200 | 18.29 | BUY |
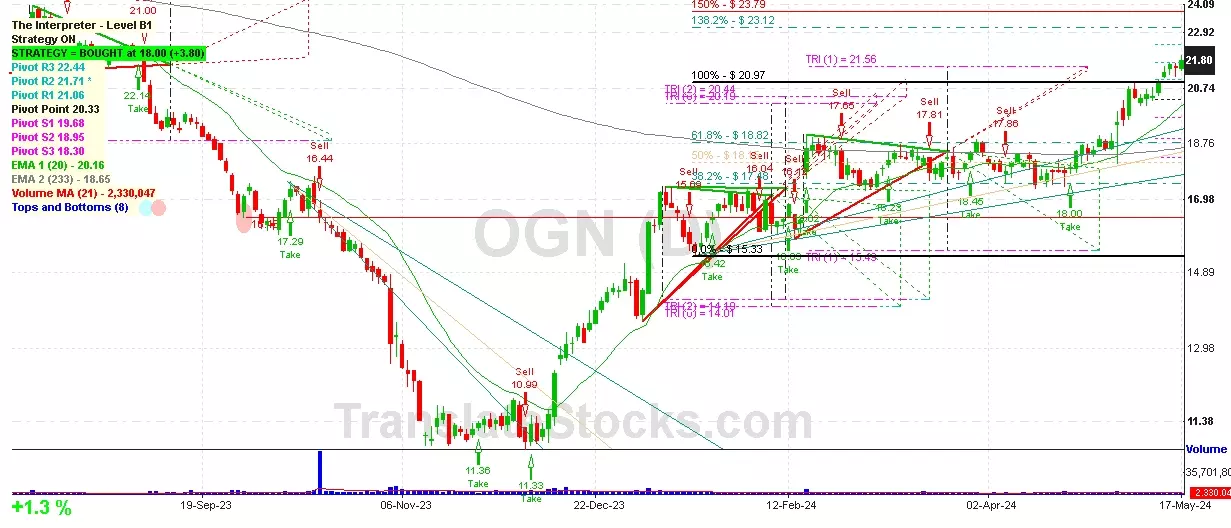
Organon & Co
IPO: 2021-05-14
Ticker: OGNIndices: S&P 500,
Exchange: New York Stock Exchange, Inc. (US - USD)
Common Stock
Life Sciences (
Pharmaceutical Preparations

 Click to Enlarge