| Date | Price $ | Result % | Candle Name | Side |
|---|---|---|---|---|
| 001 20 Feb 2024 | Sell Price: 755.66 | Profit: Open Day1 ($ 738.08) | Engulfing | Sell |
| 002 20 Dec 2023 | Sell Price: 570.21 | Loss: Close Day2 ($ 570.39) | Abandoned Baby | Sell |
| 003 25 Oct 2023 | Sell Price: 586.46 | Profit: Open Day1 ($ 580.00) | Dark Cloud Cover | Sell |
| 004 31 Jul 2023 | Sell Price: 454.14 | Profit: Close Day1 ($ 453.09) | Abandoned Baby | Sell |
| 005 31 Jul 2023 | Sell Price: 454.55 | Profit: Close Day1 ($ 453.09) | Engulfing | Sell |
| 006 13 Jun 2023 | Buy Price: 445.72 | Profit: Close Day1 ($ 447.72) | Piercing Line | Buy |
| 007 08 Jun 2023 | Buy Price: 445.66 | Profit: Open Day1 ($ 449.30) | Engulfing | Buy |
| 008One Year Average | Both Sides Result for 7 Signals |
Profit: $ 32.01 ($ 4.57 / Signal) |
All of Them | Buy + Sell |
| Simple Moving Averages (SMA) Period | Value $ | Signal | Exponential Moving Averages (EMA) Period | Value $ | Signal | |
|---|---|---|---|---|---|---|
| 2 | 729.19 | BUY | 2 | 731.77 | BUY | |
| 3 | 730.19 | BUY | 3 | 732.00 | BUY | |
| 5 | 733.52 | SELL | 5 | 733.62 | SELL | |
| 8 | 736.33 | SELL | 8 | 736.95 | SELL | |
| 13 | 743.18 | SELL | 13 | 742.28 | SELL | |
| 21 | 753.65 | SELL | 21 | 747.72 | SELL | |
| 34 | 757.77 | SELL | 34 | 748.53 | SELL | |
| 55 | 759.64 | SELL | 55 | 737.86 | SELL | |
| 90 | 707.21 | BUY | 90 | 711.24 | BUY | |
| 200 | 622.61 | BUY | 200 | 632.56 | BUY |
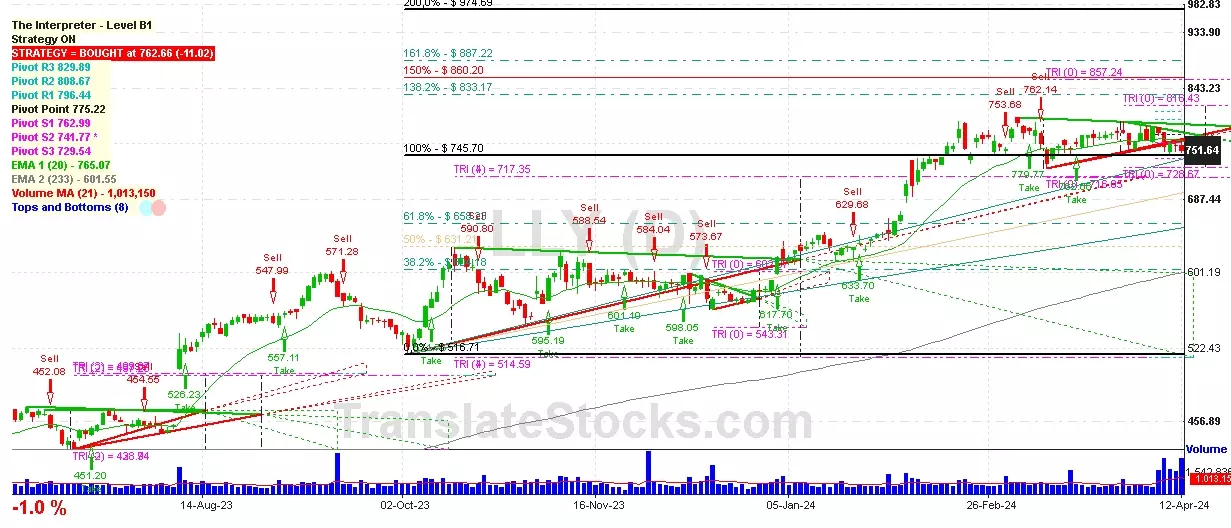
Eli Lilly & Co
IPO: 1970-07-09
Ticker: LLYIndices: S&P 500,
Exchange: New York Stock Exchange, Inc. (US - USD)
Website: https://www.lilly.com/
Phone:
Common Stock
Life Sciences (
Pharmaceutical Preparations

 Click to Enlarge