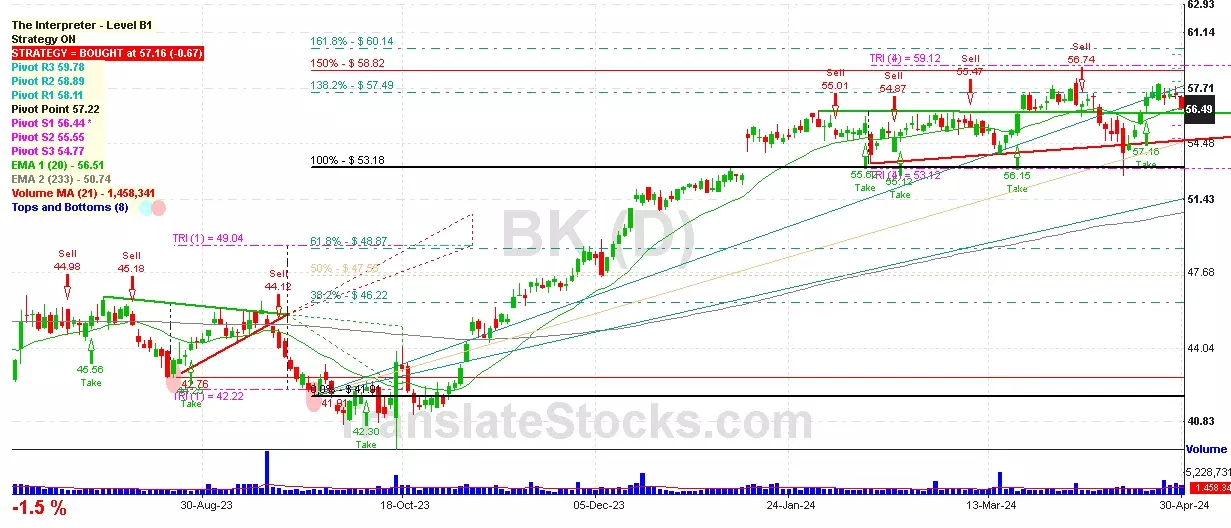
Hey Friend, I'm analysing BANK OF NEW YORK MELLON CORP (BK), and it is between the Support of $ 56.44 (PivotS1) and the Resistance of $ 57.22 (Pivot). The stock is also approaching the line of PivotS1 at $ 56.44, and if it goes below this line it could reach the next Support of 100% of Fibonacci at $ 53.18.

| Date | Price $ | Result % | Candle Name | Side |
|---|---|---|---|---|
| 001 22 Mar 2024 | Sell Price: 56.47 | Loss: Close Day2 ($ 56.61) | Engulfing | Sell |
| 002 18 Mar 2024 | Buy Price: 54.94 | Profit: Open Day1 ($ 54.99) | Abandoned Baby | Buy |
| 003 11 Mar 2024 | Buy Price: 55.61 | Profit: Open Day1 ($ 55.75) | Piercing Line | Buy |
| 004 26 Feb 2024 | Sell Price: 55.28 | Loss: Close Day2 ($ 55.66) | Abandoned Baby | Sell |
| 005 26 Feb 2024 | Sell Price: 55.34 | Profit: Open Day1 ($ 55.30) | Engulfing | Sell |
| 006 02 Jan 2024 | Buy Price: 52.38 | Profit: Open Day1 ($ 52.44) | Engulfing | Buy |
| 007 16 Nov 2023 | Sell Price: 46.48 | Loss: Close Day2 ($ 47.12) | Abandoned Baby | Sell |
| 008 08 Nov 2023 | Buy Price: 44.97 | Profit: Open Day1 ($ 45.42) | Abandoned Baby | Buy |
| 009 08 Nov 2023 | Buy Price: 45.02 | Profit: Open Day1 ($ 45.42) | Engulfing | Buy |
| 010 25 Sep 2023 | Buy Price: 42.89 | Loss: Close Day2 ($ 42.17) | Piercing Line | Buy |
| 011 02 Aug 2023 | Buy Price: 45.23 | Profit: Close Day1 ($ 45.56) | Engulfing | Buy |
| 012 14 Jul 2023 | Sell Price: 42.53 | Loss: Close Day2 ($ 45.33) | Engulfing | Sell |
| 013 26 May 2023 | Buy Price: 40.78 | Profit: Open Day1 ($ 40.80) | Abandoned Baby | Buy |
| 014One Year Average | Both Sides Result for 13 Signals |
Loss: $ -3.19 ($ -0.25 / Signal) |
All of Them | Buy + Sell |
| Simple Moving Averages (SMA) Period | Value $ | Signal | Exponential Moving Averages (EMA) Period | Value $ | Signal | |
|---|---|---|---|---|---|---|
| 2 | 56.47 | SELL | 2 | 56.56 | SELL | |
| 3 | 56.76 | SELL | 3 | 56.68 | SELL | |
| 5 | 56.95 | SELL | 5 | 56.79 | SELL | |
| 8 | 57.16 | SELL | 8 | 56.76 | SELL | |
| 13 | 56.34 | BUY | 13 | 56.64 | SELL | |
| 21 | 56.38 | BUY | 21 | 56.49 | SELL | |
| 34 | 56.31 | BUY | 34 | 56.25 | BUY | |
| 55 | 55.94 | BUY | 55 | 55.70 | BUY | |
| 90 | 55.19 | BUY | 90 | 54.46 | BUY | |
| 200 | 49.61 | BUY | 200 | 51.31 | BUY |
Bank Of New York Mellon Corp
IPO: 2007-07-02
Ticker: BKIndices: S&P 500,
Exchange: New York Stock Exchange, Inc. (US - USD)
Website: https://www.bnymellon.com/
Phone:
Common Stock
Finance (
State Commercial Banks
 Click to Enlarge