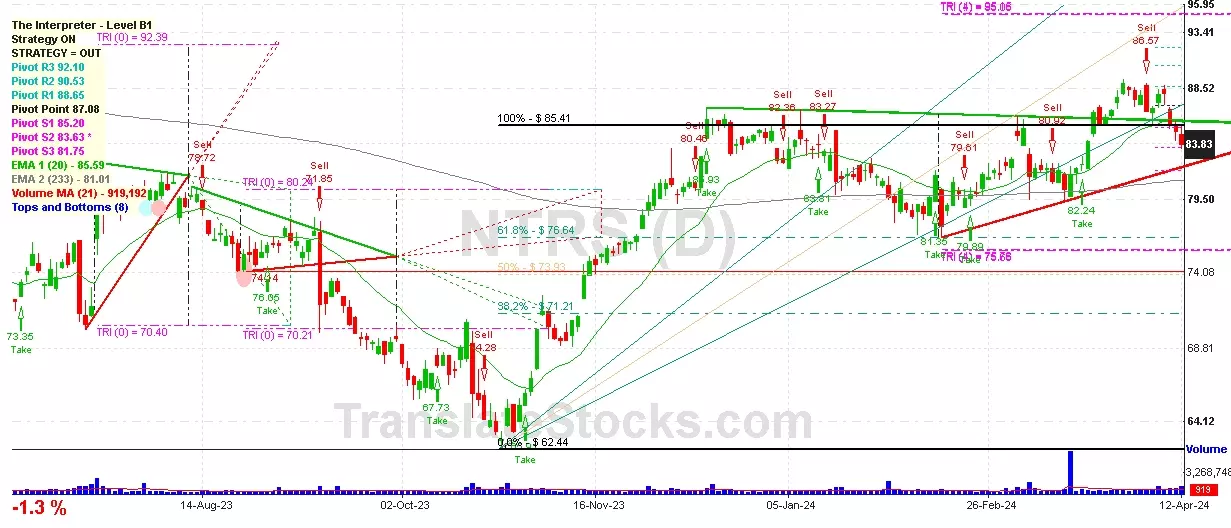
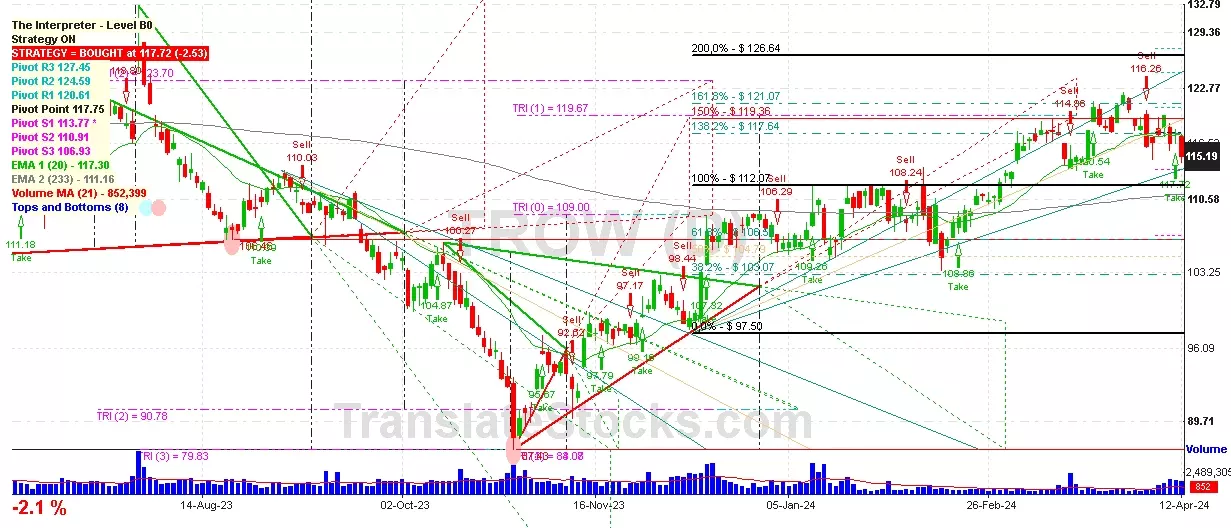
Hey Friend, I'm analysing T ROWE PRICE GROUP INC (TROW), and it is between the Support of $ 113.77 (PivotS1) and the Resistance of $ 117.64 (138.2% of Fibonacci). The stock is also approaching the line of PivotS1 at $ 113.77, and if it goes below this line it could reach the next Support of 100% of Fibonacci at $ 112.07.

| Date | Price $ | Result % | Candle Name | Side |
|---|---|---|---|---|
| 001 10 Apr 2024 | Sell Price: 116.58 | Profit: Close Day2 ($ 115.19) | Abandoned Baby | Sell |
| 002 26 Feb 2024 | Sell Price: 110.46 | Profit: Open Day2 ($ 110.42) | Abandoned Baby | Sell |
| 003 12 Feb 2024 | Buy Price: 109.99 | Loss: Close Day2 ($ 106.36) | Engulfing | Buy |
| 004 16 Jan 2024 | Sell Price: 106.56 | Profit: Open Day1 ($ 105.03) | Abandoned Baby | Sell |
| 005 25 Sep 2023 | Buy Price: 105.95 | Loss: Close Day2 ($ 103.54) | Piercing Line | Buy |
| 006 19 Sep 2023 | Buy Price: 110.60 | Profit: Open Day1 ($ 111.21) | Engulfing | Buy |
| 007 14 Sep 2023 | Buy Price: 110.05 | Loss: Close Day2 ($ 109.05) | Engulfing | Buy |
| 008 20 Jul 2023 | Sell Price: 120.25 | Profit: Close Day1 ($ 119.70) | Abandoned Baby | Sell |
| 009 23 May 2023 | Sell Price: 106.02 | Profit: Open Day1 ($ 105.32) | Engulfing | Sell |
| 010 08 May 2023 | Sell Price: 106.34 | Profit: Open Day1 ($ 105.00) | Engulfing | Sell |
| 011One Year Average | Both Sides Result for 10 Signals |
Loss: $ -0.88 ($ -0.09 / Signal) |
All of Them | Buy + Sell |
| Simple Moving Averages (SMA) Period | Value $ | Signal | Exponential Moving Averages (EMA) Period | Value $ | Signal | |
|---|---|---|---|---|---|---|
| 2 | 109.95 | SELL | 2 | 109.62 | SELL | |
| 3 | 110.61 | SELL | 3 | 110.00 | SELL | |
| 5 | 110.41 | SELL | 5 | 110.46 | SELL | |
| 8 | 110.54 | SELL | 8 | 111.19 | SELL | |
| 13 | 112.90 | SELL | 13 | 112.35 | SELL | |
| 21 | 115.15 | SELL | 21 | 113.50 | SELL | |
| 34 | 115.95 | SELL | 34 | 113.98 | SELL | |
| 55 | 114.06 | SELL | 55 | 113.35 | SELL | |
| 90 | 111.83 | SELL | 90 | 111.83 | SELL | |
| 200 | 108.43 | BUY | 200 | 110.44 | SELL |
T Rowe Price Group Inc
IPO: 1986-01-04
Ticker: TROWIndices: S&P 500,
Exchange: Nasdaq Nms - Global Market (US - USD)
Website: https://www.troweprice.com
Phone:
Common Stock
Finance (
Security & Commodity Brokers, Dealers, Exchanges & Services
 Click to Enlarge