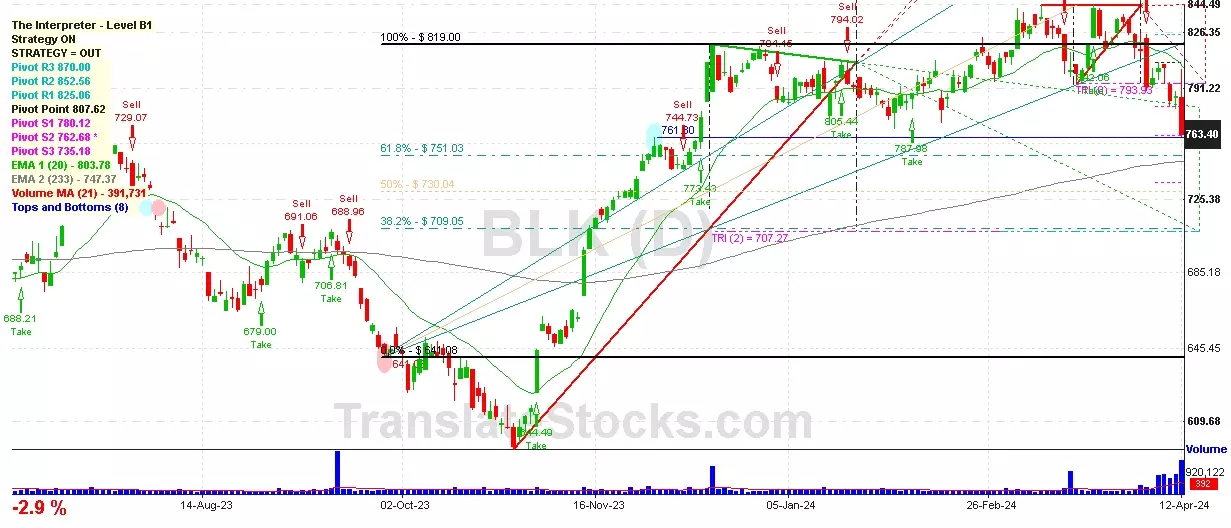
Hey Friend, I'm analysing BLACKROCK INC (BLK), and it is between the Support of $ 762.68 (PivotS2) and the Resistance of $ 780.12 (PivotS1). The stock is also approaching the line of PivotS2 at $ 762.68, and if it goes below this line it could reach the next Support of 61.8% of Fibonacci at $ 751.03.

| Date | Price $ | Result % | Candle Name | Side |
|---|---|---|---|---|
| 001 10 Apr 2024 | Sell Price: 783.65 | Profit: Close Day2 ($ 762.51) | Abandoned Baby | Sell |
| 002 28 Feb 2024 | Buy Price: 809.66 | Profit: Open Day1 ($ 813.40) | Engulfing | Buy |
| 003 26 Feb 2024 | Sell Price: 806.03 | Profit: Close Day1 ($ 800.54) | Abandoned Baby | Sell |
| 004 13 Feb 2024 | Sell Price: 778.07 | Loss: Close Day2 ($ 798.05) | Abandoned Baby | Sell |
| 005 22 Jan 2024 | Sell Price: 794.02 | Profit: Open Day1 ($ 793.27) | Engulfing | Sell |
| 006 08 Nov 2023 | Buy Price: 654.95 | Profit: Open Day1 ($ 656.73) | Engulfing | Buy |
| 007 15 Sep 2023 | Sell Price: 697.41 | Profit: Open Day1 ($ 696.32) | Abandoned Baby | Sell |
| 008 17 Aug 2023 | Buy Price: 674.00 | Loss: Close Day2 ($ 671.82) | Abandoned Baby | Buy |
| 009 08 Aug 2023 | Sell Price: 696.98 | Profit: Open Day1 ($ 695.26) | Abandoned Baby | Sell |
| 010 04 Aug 2023 | Buy Price: 710.57 | Profit: Open Day1 ($ 713.31) | Engulfing | Buy |
| 011One Year Average | Both Sides Result for 10 Signals |
Profit: $ 16.29 ($ 1.63 / Signal) |
All of Them | Buy + Sell |
| Simple Moving Averages (SMA) Period | Value $ | Signal | Exponential Moving Averages (EMA) Period | Value $ | Signal | |
|---|---|---|---|---|---|---|
| 2 | 760.05 | SELL | 2 | 759.07 | SELL | |
| 3 | 762.24 | SELL | 3 | 759.48 | SELL | |
| 5 | 759.36 | SELL | 5 | 759.61 | SELL | |
| 8 | 755.95 | BUY | 8 | 761.61 | SELL | |
| 13 | 765.19 | SELL | 13 | 767.75 | SELL | |
| 21 | 784.16 | SELL | 21 | 777.01 | SELL | |
| 34 | 797.63 | SELL | 34 | 785.72 | SELL | |
| 55 | 801.06 | SELL | 55 | 788.78 | SELL | |
| 90 | 798.44 | SELL | 90 | 781.53 | SELL | |
| 200 | 738.17 | BUY | 200 | 752.65 | BUY |
Blackrock Inc
IPO: 1999-10-01
Ticker: BLKIndices: S&P 500,
Exchange: New York Stock Exchange, Inc. (US - USD)
Website: https://www.blackrock.com/
Phone:
Common Stock
Finance (
Security Brokers, Dealers & Flotation Companies
 Click to Enlarge