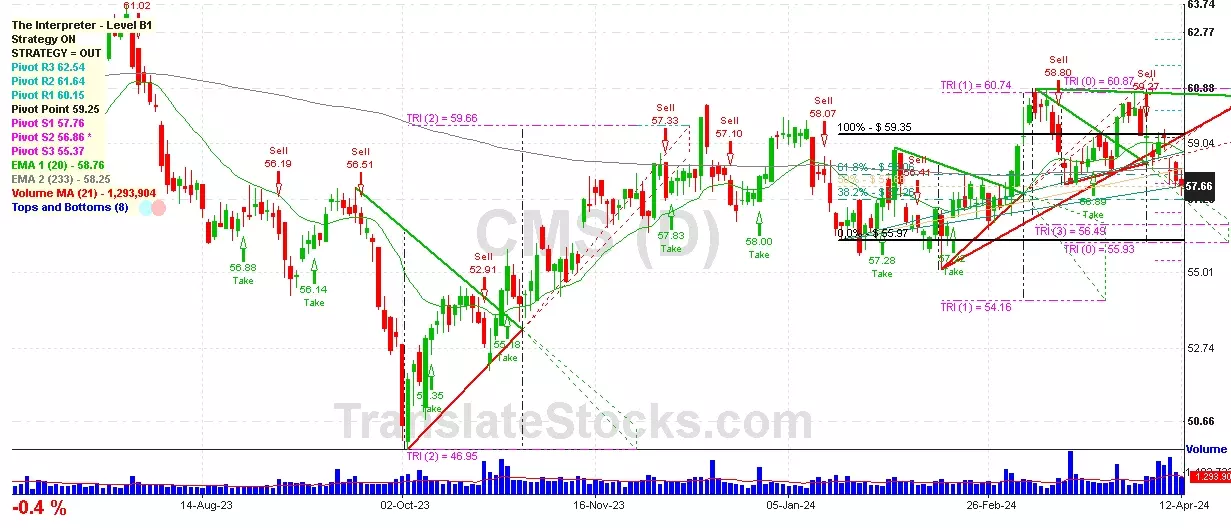
Hey Friend, I'm analysing CMS ENERGY CORP (CMS), and it is between the Support of $ 57.66 (50% of Fibonacci) and the Resistance of $ 57.76 (PivotS1). The stock is falling and may come close and reach $ 57.66 soon. Since it is nailed exactly on the line of $ 57.66, we should wait for another day to better understand which side the stock will move to.

| Date | Price $ | Result % | Candle Name | Side |
|---|---|---|---|---|
| 001 07 Mar 2024 | Sell Price: 60.08 | Loss: Close Day2 ($ 60.46) | Dark Cloud Cover | Sell |
| 002 31 Jan 2024 | Sell Price: 57.16 | Loss: Close Day2 ($ 57.76) | Dark Cloud Cover | Sell |
| 003 05 Jan 2024 | Sell Price: 59.34 | Profit: Open Day1 ($ 59.08) | Abandoned Baby | Sell |
| 004 12 Dec 2023 | Sell Price: 57.97 | Loss: Close Day2 ($ 58.96) | Dark Cloud Cover | Sell |
| 005 16 Jun 2023 | Sell Price: 60.74 | Profit: Open Day1 ($ 60.57) | Engulfing | Sell |
| 006 16 Jun 2023 | Sell Price: 60.68 | Profit: Open Day1 ($ 60.57) | Dark Cloud Cover | Sell |
| 007 11 May 2023 | Sell Price: 61.55 | Profit: Close Day2 ($ 60.74) | Engulfing | Sell |
| 008 28 Apr 2023 | Sell Price: 62.26 | Profit: Open Day1 ($ 62.03) | Dark Cloud Cover | Sell |
| 009One Year Average | Both Sides Result for 8 Signals |
Loss: $ -0.39 ($ -0.05 / Signal) |
All of Them | Buy + Sell |
| Simple Moving Averages (SMA) Period | Value $ | Signal | Exponential Moving Averages (EMA) Period | Value $ | Signal | |
|---|---|---|---|---|---|---|
| 2 | 60.39 | BUY | 2 | 60.37 | BUY | |
| 3 | 60.24 | BUY | 3 | 60.23 | BUY | |
| 5 | 60.05 | BUY | 5 | 59.92 | BUY | |
| 8 | 59.24 | BUY | 8 | 59.58 | BUY | |
| 13 | 58.80 | BUY | 13 | 59.29 | BUY | |
| 21 | 59.10 | BUY | 21 | 59.08 | BUY | |
| 34 | 59.01 | BUY | 34 | 58.87 | BUY | |
| 55 | 58.43 | BUY | 55 | 58.59 | BUY | |
| 90 | 58.14 | BUY | 90 | 58.23 | BUY | |
| 200 | 57.33 | BUY | 200 | 58.18 | BUY |
Cms Energy Corp
IPO: 1947-02-03
Ticker: CMSIndices: S&P 500,
Exchange: New York Stock Exchange, Inc. (US - USD)
Website: https://www.cmsenergy.com/
Phone:
Common Stock
Energy & Transportation (
Electric & Other Services Combined
 Click to Enlarge