| Date | Price $ | Result % | Candle Name | Side |
|---|---|---|---|---|
| 001 08 Apr 2024 | Buy Price: 90.60 | Profit: Open Day1 ($ 90.78) | Abandoned Baby | Buy |
| 002 08 Apr 2024 | Buy Price: 90.51 | Profit: Open Day1 ($ 90.78) | Engulfing | Buy |
| 003 15 Mar 2024 | Buy Price: 88.94 | Profit: Close Day1 ($ 88.99) | Piercing Line | Buy |
| 004 01 Mar 2024 | Sell Price: 87.01 | Profit: Open Day1 ($ 86.56) | Abandoned Baby | Sell |
| 005 22 Feb 2024 | Sell Price: 87.91 | Profit: Open Day2 ($ 87.71) | Abandoned Baby | Sell |
| 006 14 Dec 2023 | Sell Price: 91.91 | Profit: Open Day1 ($ 91.50) | Engulfing | Sell |
| 007 11 Dec 2023 | Buy Price: 91.87 | Profit: Open Day1 ($ 92.09) | Piercing Line | Buy |
| 008 11 Jul 2023 | Buy Price: 92.54 | Profit: Open Day1 ($ 92.81) | Engulfing | Buy |
| 009 16 Jun 2023 | Sell Price: 92.97 | Profit: Close Day1 ($ 92.02) | Engulfing | Sell |
| 010 31 May 2023 | Buy Price: 93.30 | Profit: Open Day1 ($ 93.71) | Abandoned Baby | Buy |
| 011 15 May 2023 | Sell Price: 98.48 | Profit: Open Day1 ($ 97.47) | Engulfing | Sell |
| 012 01 May 2023 | Buy Price: 99.11 | Profit: Open Day2 ($ 99.39) | Engulfing | Buy |
| 013One Year Average | Both Sides Result for 12 Signals |
Profit: $ 4.70 ($ 0.39 / Signal) |
All of Them | Buy + Sell |
| Simple Moving Averages (SMA) Period | Value $ | Signal | Exponential Moving Averages (EMA) Period | Value $ | Signal | |
|---|---|---|---|---|---|---|
| 2 | 93.77 | BUY | 2 | 93.80 | BUY | |
| 3 | 93.46 | BUY | 3 | 93.50 | BUY | |
| 5 | 92.98 | BUY | 5 | 92.91 | BUY | |
| 8 | 91.69 | BUY | 8 | 92.21 | BUY | |
| 13 | 90.77 | BUY | 13 | 91.49 | BUY | |
| 21 | 90.58 | BUY | 21 | 90.86 | BUY | |
| 34 | 90.03 | BUY | 34 | 90.35 | BUY | |
| 55 | 89.29 | BUY | 55 | 90.05 | BUY | |
| 90 | 89.90 | BUY | 90 | 89.96 | BUY | |
| 200 | 90.02 | BUY | 200 | 90.41 | BUY |
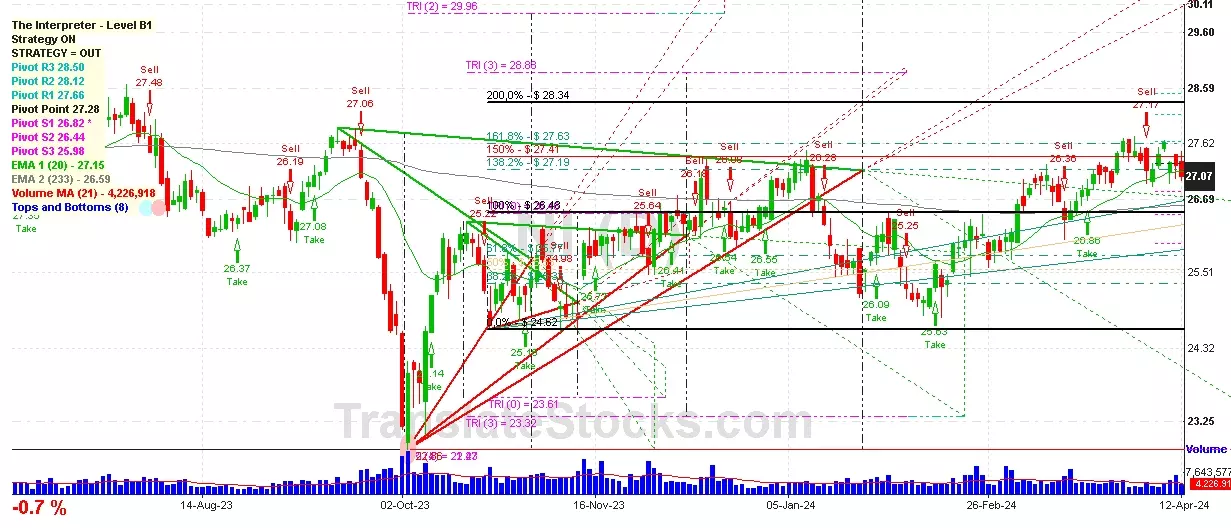
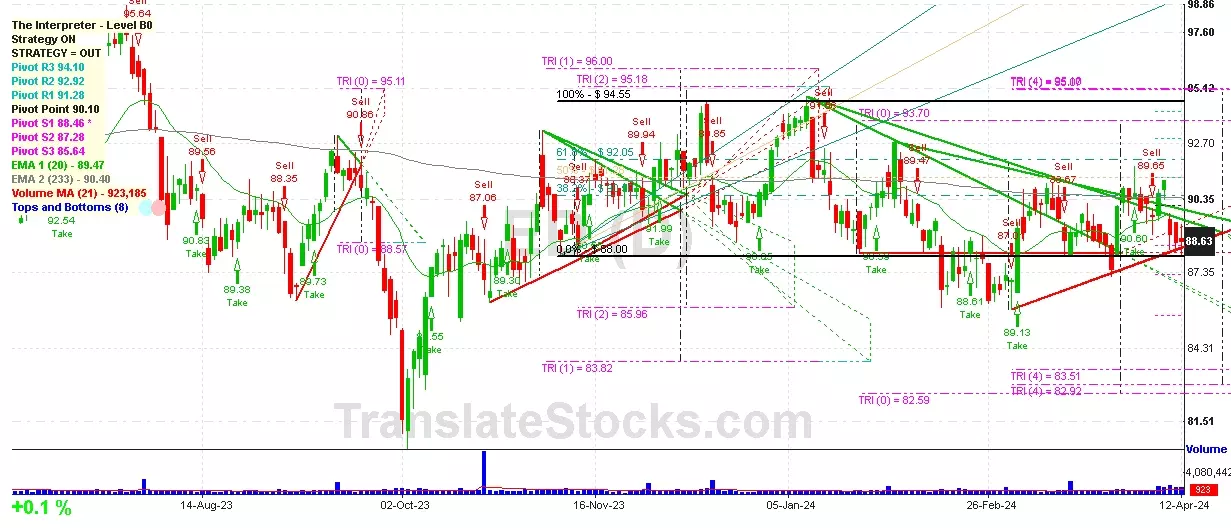
Consolidated Edison Inc
IPO: 1948-06-21
Ticker: EDIndices: S&P 500,
Exchange: New York Stock Exchange, Inc. (US - USD)
Website: https://www.conedison.com/
Phone:
Common Stock
Energy & Transportation (
Electric & Other Services Combined

 Click to Enlarge