| Date | Price $ | Result % | Candle Name | Side |
|---|---|---|---|---|
| 001 03 Apr 2024 | Buy Price: 214.94 | Profit: Open Day1 ($ 217.85) | Piercing Line | Buy |
| 002 01 Apr 2024 | Sell Price: 216.56 | Profit: Open Day1 ($ 215.43) | Engulfing | Sell |
| 003 29 Feb 2024 | Buy Price: 213.41 | Profit: Close Day1 ($ 218.14) | Abandoned Baby | Buy |
| 004 29 Feb 2024 | Buy Price: 213.96 | Profit: Close Day1 ($ 218.14) | Engulfing | Buy |
| 005 25 Jan 2024 | Sell Price: 272.35 | Loss: Close Day2 ($ 278.36) | Abandoned Baby | Sell |
| 006 25 Jan 2024 | Sell Price: 273.37 | Loss: Close Day2 ($ 278.36) | Engulfing | Sell |
| 007 09 Jan 2024 | Sell Price: 272.38 | Profit: Open Day1 ($ 271.87) | Abandoned Baby | Sell |
| 008 20 Nov 2023 | Buy Price: 228.55 | Profit: Open Day1 ($ 229.29) | Piercing Line | Buy |
| 009 14 Nov 2023 | Buy Price: 228.17 | Profit: Open Day2 ($ 228.47) | Abandoned Baby | Buy |
| 010 25 Oct 2023 | Sell Price: 214.08 | Profit: Close Day1 ($ 212.60) | Abandoned Baby | Sell |
| 011 24 Oct 2023 | Buy Price: 235.92 | Loss: Close Day2 ($ 212.60) | Abandoned Baby | Buy |
| 012 14 Sep 2023 | Buy Price: 229.04 | Profit: Open Day1 ($ 230.42) | Engulfing | Buy |
| 013 10 Aug 2023 | Sell Price: 236.63 | Profit: Close Day1 ($ 234.25) | Engulfing | Sell |
| 014 14 Jul 2023 | Sell Price: 250.54 | Profit: Open Day1 ($ 249.55) | Engulfing | Sell |
| 015 16 Jun 2023 | Sell Price: 277.15 | Profit: Open Day1 ($ 274.97) | Dark Cloud Cover | Sell |
| 016 26 May 2023 | Buy Price: 279.28 | Profit: Open Day1 ($ 279.33) | Engulfing | Buy |
| 017 11 May 2023 | Sell Price: 300.25 | Profit: Close Day1 ($ 299.23) | Abandoned Baby | Sell |
| 018One Year Average | Both Sides Result for 17 Signals |
Loss: $ -10.34 ($ -0.61 / Signal) |
All of Them | Buy + Sell |
| Simple Moving Averages (SMA) Period | Value $ | Signal | Exponential Moving Averages (EMA) Period | Value $ | Signal | |
|---|---|---|---|---|---|---|
| 2 | 201.69 | BUY | 2 | 202.03 | SELL | |
| 3 | 202.53 | SELL | 3 | 202.38 | SELL | |
| 5 | 203.36 | SELL | 5 | 203.04 | SELL | |
| 8 | 203.24 | SELL | 8 | 204.35 | SELL | |
| 13 | 206.66 | SELL | 13 | 206.69 | SELL | |
| 21 | 212.03 | SELL | 21 | 209.60 | SELL | |
| 34 | 215.02 | SELL | 34 | 213.40 | SELL | |
| 55 | 215.41 | SELL | 55 | 218.94 | SELL | |
| 90 | 235.97 | SELL | 90 | 225.92 | SELL | |
| 200 | 236.93 | SELL | 200 | 241.45 | SELL |
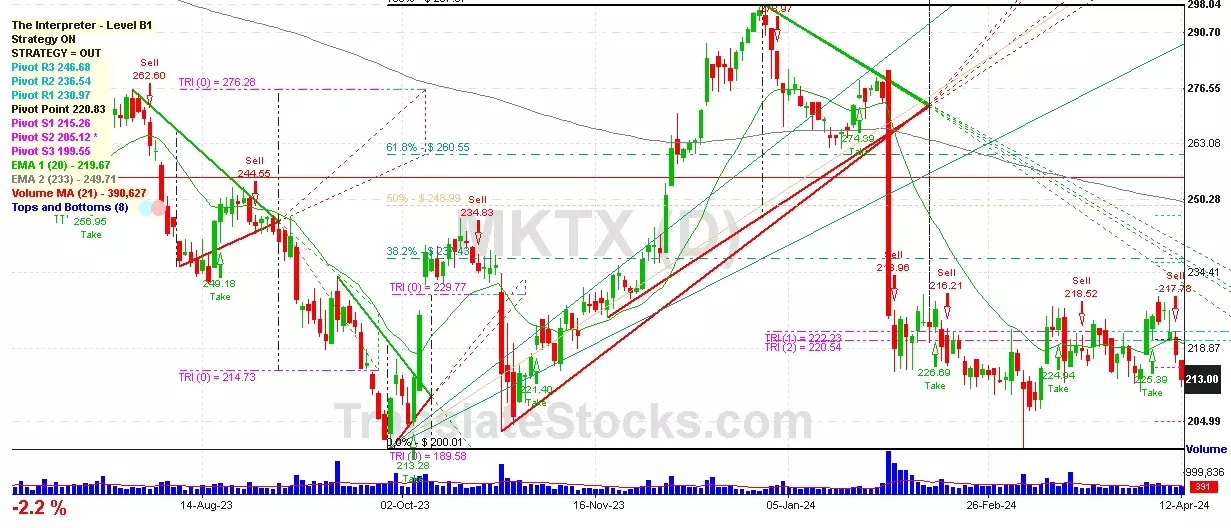
Marketaxess Holdings Inc
IPO: 2004-11-05
Ticker: MKTXIndices: S&P 500,
Exchange: Nasdaq Nms - Global Market (US - USD)
Website: https://www.marketaxess.com/
Phone:
Common Stock
Finance (
Security Brokers, Dealers & Flotation Companies

 Click to Enlarge