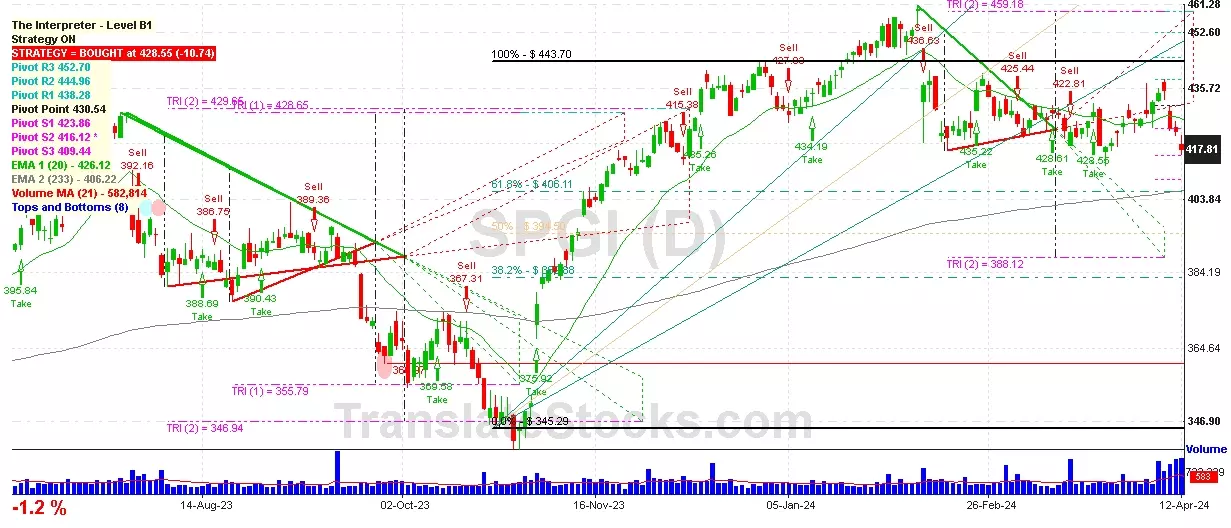
Hey Friend, I'm analysing S&P GLOBAL INC (SPGI), and it is between the Support of $ 416.12 (PivotS2) and the Resistance of $ 423.86 (PivotS1). The stock is also approaching the line of PivotS2 at $ 416.12, and if it goes below this line it could reach the next Support of 61.8% of Fibonacci at $ 406.11.

| Date | Price $ | Result % | Candle Name | Side |
|---|---|---|---|---|
| 001 17 Apr 2024 | Buy Price: 412.11 | Profit: Open Day1 ($ 414.96) | Abandoned Baby | Buy |
| 002 03 Apr 2024 | Buy Price: 426.46 | Profit: Open Day1 ($ 429.12) | Piercing Line | Buy |
| 003 02 Apr 2024 | Sell Price: 426.11 | Profit: Open Day1 ($ 424.93) | Abandoned Baby | Sell |
| 004 22 Mar 2024 | Sell Price: 419.13 | Profit: Open Day1 ($ 417.44) | Engulfing | Sell |
| 005 06 Mar 2024 | Buy Price: 426.14 | Profit: Open Day1 ($ 430.73) | Abandoned Baby | Buy |
| 006 16 Jan 2024 | Sell Price: 436.55 | Profit: Open Day1 ($ 433.84) | Abandoned Baby | Sell |
| 007 20 Dec 2023 | Sell Price: 427.83 | Loss: Close Day2 ($ 434.84) | Engulfing | Sell |
| 008 11 Dec 2023 | Buy Price: 423.75 | Profit: Close Day1 ($ 426.81) | Abandoned Baby | Buy |
| 009 25 Oct 2023 | Buy Price: 349.13 | Loss: Close Day2 ($ 342.48) | Piercing Line | Buy |
| 010 05 Sep 2023 | Sell Price: 393.55 | Profit: Open Day1 ($ 393.19) | Engulfing | Sell |
| 011 11 Aug 2023 | Sell Price: 387.69 | Profit: Open Day2 ($ 385.82) | Abandoned Baby | Sell |
| 012 10 Jul 2023 | Buy Price: 398.43 | Profit: Open Day2 ($ 403.82) | Abandoned Baby | Buy |
| 013 07 Jun 2023 | Sell Price: 374.19 | Loss: Close Day2 ($ 384.00) | Engulfing | Sell |
| 014One Year Average | Both Sides Result for 13 Signals |
Profit: $ 2.89 ($ 0.22 / Signal) |
All of Them | Buy + Sell |
| Simple Moving Averages (SMA) Period | Value $ | Signal | Exponential Moving Averages (EMA) Period | Value $ | Signal | |
|---|---|---|---|---|---|---|
| 2 | 414.39 | BUY | 2 | 414.84 | BUY | |
| 3 | 414.01 | BUY | 3 | 414.58 | BUY | |
| 5 | 414.31 | BUY | 5 | 414.44 | BUY | |
| 8 | 413.20 | BUY | 8 | 415.00 | BUY | |
| 13 | 416.53 | SELL | 13 | 416.54 | SELL | |
| 21 | 420.81 | SELL | 21 | 418.72 | SELL | |
| 34 | 422.12 | SELL | 34 | 421.33 | SELL | |
| 55 | 425.09 | SELL | 55 | 423.27 | SELL | |
| 90 | 431.01 | SELL | 90 | 421.94 | SELL | |
| 200 | 408.40 | BUY | 200 | 409.54 | BUY |
S&p Global Inc
IPO: 1929-02-14
Ticker: SPGIIndices: S&P 500,
Exchange: New York Stock Exchange, Inc. (US - USD)
Website: https://www.spglobal.com/
Phone:
Common Stock
Trade & Services (
Services-consumer Credit Reporting, Collection Agencies
 Click to Enlarge