| Date | Price $ | Result % | Candle Name | Side |
|---|---|---|---|---|
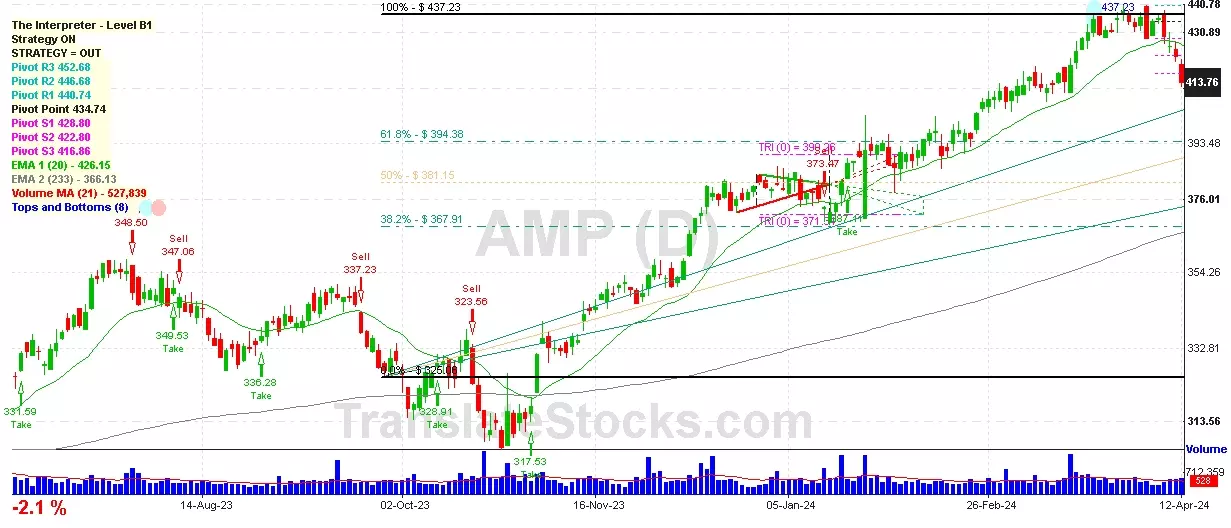
| 001 01 Apr 2024 | Sell Price: 434.83 | Profit: Open Day1 ($ 434.67) | Abandoned Baby | Sell |
| 002 22 Mar 2024 | Sell Price: 430.16 | Profit: Open Day1 ($ 429.05) | Engulfing | Sell |
| 003 15 Mar 2024 | Buy Price: 419.45 | Profit: Open Day1 ($ 420.51) | Abandoned Baby | Buy |
| 004 15 Mar 2024 | Buy Price: 419.49 | Profit: Open Day1 ($ 420.51) | Engulfing | Buy |
| 005 14 Mar 2024 | Sell Price: 413.95 | Profit: Open Day1 ($ 410.39) | Dark Cloud Cover | Sell |
| 006 12 Mar 2024 | Buy Price: 412.99 | Profit: Open Day1 ($ 413.68) | Abandoned Baby | Buy |
| 007 29 Feb 2024 | Sell Price: 407.36 | Loss: Close Day2 ($ 412.44) | Engulfing | Sell |
| 008 29 Feb 2024 | Sell Price: 408.10 | Profit: Open Day1 ($ 407.67) | Dark Cloud Cover | Sell |
| 009 13 Feb 2024 | Sell Price: 389.89 | Loss: Close Day2 ($ 397.83) | Abandoned Baby | Sell |
| 010 02 Feb 2024 | Buy Price: 390.69 | Loss: Close Day2 ($ 387.95) | Engulfing | Buy |
| 011 18 Jan 2024 | Buy Price: 374.88 | Profit: Open Day1 ($ 377.63) | Abandoned Baby | Buy |
| 012 03 Jan 2024 | Buy Price: 380.54 | Profit: Close Day2 ($ 381.97) | Abandoned Baby | Buy |
| 013 27 Nov 2023 | Sell Price: 349.47 | Profit: Open Day1 ($ 349.04) | Abandoned Baby | Sell |
| 014 06 Nov 2023 | Sell Price: 333.17 | Profit: Open Day1 ($ 332.95) | Engulfing | Sell |
| 015 28 Sep 2023 | Buy Price: 330.35 | Profit: Open Day1 ($ 332.22) | Engulfing | Buy |
| 016 25 Sep 2023 | Buy Price: 335.67 | Loss: Close Day2 ($ 326.98) | Piercing Line | Buy |
| 017 26 Jun 2023 | Buy Price: 319.92 | Profit: Open Day1 ($ 320.12) | Abandoned Baby | Buy |
| 018 26 Jun 2023 | Buy Price: 319.89 | Profit: Open Day1 ($ 320.12) | Engulfing | Buy |
| 019 31 May 2023 | Sell Price: 298.47 | Loss: Close Day2 ($ 313.20) | Abandoned Baby | Sell |
| 020 01 May 2023 | Sell Price: 302.58 | Profit: Open Day1 ($ 301.83) | Dark Cloud Cover | Sell |
| 021One Year Average | Both Sides Result for 20 Signals |
Loss: $ -23.26 ($ -1.16 / Signal) |
All of Them | Buy + Sell |
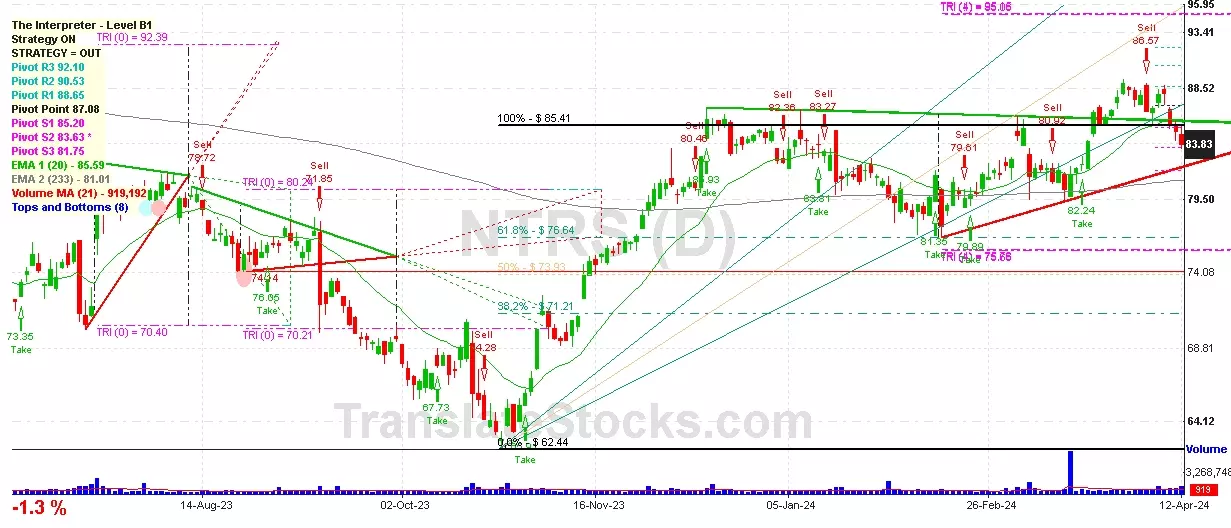
| Simple Moving Averages (SMA) Period | Value $ | Signal | Exponential Moving Averages (EMA) Period | Value $ | Signal | |
|---|---|---|---|---|---|---|
| 2 | 410.42 | SELL | 2 | 410.37 | SELL | |
| 3 | 411.23 | SELL | 3 | 410.84 | SELL | |
| 5 | 412.55 | SELL | 5 | 411.71 | SELL | |
| 8 | 413.02 | SELL | 8 | 413.11 | SELL | |
| 13 | 414.49 | SELL | 13 | 415.46 | SELL | |
| 21 | 421.91 | SELL | 21 | 417.60 | SELL | |
| 34 | 423.06 | SELL | 34 | 417.26 | SELL | |
| 55 | 415.69 | SELL | 55 | 412.37 | SELL | |
| 90 | 402.75 | BUY | 90 | 401.77 | BUY | |
| 200 | 368.06 | BUY | 200 | 375.61 | BUY |
Ameriprise Financial Inc
IPO: 2005-09-15
Ticker: AMPIndices: S&P 500,
Exchange: New York Stock Exchange, Inc. (US - USD)
Website: https://www.ameriprise.com
Phone:
Common Stock
Finance (
Investment Advice
Year | 2020 | 2019 | 2018 | 2017 | 2016 | 2015 | 2014 | 2013 | 2012 | 2011 | 2010 | 2009 | 2008 | 2007 | 2006 | |
|---|---|---|---|---|---|---|---|---|---|---|---|---|---|---|---|---|
| 1 | Assets + | 165,883 | 151,828 | 137,216 | 147,470 | 139,821 | 145,342 | 148,810 | 144,576 | 134,729 | 133,986 | 131,192 | 113,774 | 95,577 | 3,836 | 2,760 |
| 2 | Cash and Cash Equivalents + | 0 | 0 | 0 | 0 | 2,318 | 2,357 | 2,638 | 2,632 | 2,371 | 2,781 | 2,861 | 3,097 | 6,228 | 3,836 | 2,760 |
| 3 | Property + | 602 | 610 | 635 | 626 | 607 | 724 | 667 | 705 | 753 | 774 | 693 | 728 | 0 | 0 | 0 |
| 4 | Intangible Assets + | 108 | 113 | 116 | 138 | 108 | 133 | 159 | 199 | 241 | 282 | 333 | 269 | 0 | 0 | 0 |
| 5 | Finite-Lived Intangible Assets + | 108 | 113 | 116 | 138 | 108 | 133 | 159 | 199 | 241 | 282 | 333 | 269 | 0 | 0 | 0 |
| 6 | Liabilities and Equity + | 165,883 | 151,828 | 137,216 | 147,470 | 139,821 | 145,342 | 148,810 | 144,576 | 134,729 | 133,986 | 131,192 | 113,774 | 95,577 | 8,188 | 8,356 |
| 7 | Liabilities + | 160,016 | 146,099 | 131,628 | 141,472 | 133,529 | 136,937 | 139,505 | 135,344 | 125,017 | 123,025 | 119,907 | 103,898 | 89,110 | 0 | 0 |
| 8 | Stockholders' Equity + | 5,867 | 5,729 | 5,588 | 5,998 | 6,292 | 8,405 | 9,305 | 9,232 | 9,712 | 9,694 | 9,950 | 9,876 | 6,467 | 8,188 | 8,356 |
| 9 | Stockholders' Equity Attributable to Parent + | 5,867 | 5,729 | 5,588 | 5,995 | 6,292 | 7,217 | 8,124 | 8,192 | 9,092 | 10,255 | 10,725 | 9,273 | 6,178 | 0 | 0 |
| 10 | Stockholders' Equity + | 0.01 | 0.01 | 0.01 | 0.01 | 0.01 | 0.01 | 0.01 | 0.01 | 0.01 | 0.01 | 0.01 | 0.01 | 0.01 | 0 | 0 |
| 11 | Common Stock + | 0.01 | 0.01 | 0.01 | 0.01 | 0.01 | 0.01 | 0.01 | 0.01 | 0.01 | 0.01 | 0.01 | 0.01 | 0.01 | 0 | 0 |
| 12 | Partners' Capital + | 15,292 | 14,279 | 12,909 | 11,329 | 10,351 | 9,551 | 8,469 | 7,289 | 6,381 | 6,983 | 6,190 | 5,282 | 4,592 | 0 | 0 |
| 13 | Partners' Capital + | 15,292 | 14,279 | 12,909 | 11,329 | 10,351 | 9,551 | 8,469 | 7,289 | 6,381 | 6,983 | 6,190 | 5,282 | 4,592 | 0 | 0 |
| 14 | Limited Liability Company (LLC) Members' Equity + | 15,921 | 14,541 | 12,618 | 11,558 | 10,551 | 9,804 | 9,131 | 7,884 | 7,575 | 7,621 | 6,755 | 5,545 | 3,499 | 0 | 0 |
| 15 | Limited Liability Company (LLC) Members' Equity + | 15,921 | 14,541 | 12,618 | 11,558 | 10,551 | 9,804 | 9,131 | 7,884 | 7,575 | 7,621 | 6,755 | 5,545 | 3,499 | 0 | 0 |
| 16 | Current Other Undisclosed Assets | 0 | 0 | 0 | 0 | 0 | 0 | 0 | 0 | 0 | 0 | 0 | 0 | 87,466 | 0 | 0 |
| 17 | Current Assets + | 0 | 0 | 0 | 0 | 0 | 0 | 0 | 0 | 0 | 0 | 0 | 1,633 | 89,349 | 0 | 0 |
| 18 | Cash + | 0 | 0 | 0 | 0 | 0 | 0 | 0 | 0 | 0 | 0 | 0 | 1,633 | 1,883 | 0 | 0 |
| 19 | Long-Term Assets + | 1,176 | 1,167 | 1,158 | 1,175 | 1,104 | 1,137 | 1,154 | 1,164 | 1,174 | 1,164 | 1,161 | 0 | 0 | 0 | 0 |
| 20 | Increase (Decrease) in Stockholders' Equity [Roll Forward] + | -18,879 | -17,276 | -15,293 | -13,648 | -12,027 | -10,338 | -8,589 | -6,961 | -5,325 | -4,034 | -2,620 | -2,023 | -2,012 | 0 | 0 |
| 21 | Treasury Stock Transactions + | -18,879 | -17,276 | -15,293 | -13,648 | -12,027 | -10,338 | -8,589 | -6,961 | -5,325 | -4,034 | -2,620 | -2,023 | -2,012 | 0 | 0 |
| 22 | Treasury Stock + | -18,879 | -17,276 | -15,293 | -13,648 | -12,027 | -10,338 | -8,589 | -6,961 | -5,325 | -4,034 | -2,620 | -2,023 | -2,012 | 0 | 0 |
| 23 | Goodwill + | 1,176 | 1,167 | 1,158 | 1,175 | 1,104 | 1,137 | 1,154 | 1,164 | 1,174 | 1,164 | 1,161 | 0 | 0 | 0 | 0 |
| 24 | Total Assets + | 165,883 | 151,828 | 137,216 | 147,470 | 139,821 | 145,342 | 148,810 | 144,576 | 134,729 | 133,986 | 131,192 | 113,774 | 95,577 | 0 | 0 |
| 25 | Total Liabilities + | 160,016 | 146,099 | 131,628 | 141,472 | 133,529 | 136,937 | 139,505 | 135,344 | 125,017 | 123,025 | 119,907 | 103,898 | 89,110 | 0 | 0 |
| 26 | Stockholders' Equity Attributable to Noncontrolling Interest + | 0 | 0 | 0 | 0 | 0 | 1,188 | 1,181 | 1,040 | 620 | 706 | 560 | 603 | 289 | 0 | 0 |
| 27 | Total Stockholders' Equity + | 5,867 | 5,729 | 5,588 | 5,998 | 6,292 | 8,405 | 9,305 | 9,232 | 9,712 | 9,694 | 9,950 | 9,876 | 6,467 | 8,188 | 8,356 |
| 28 | Total Liabilities and Equity + | 165,883 | 151,828 | 137,216 | 147,470 | 139,821 | 145,342 | 148,810 | 144,576 | 134,729 | 133,986 | 131,192 | 113,774 | 95,577 | 0 | 0 |
Year | 2020 | 2019 | 2018 | 2017 | 2016 | 2015 | 2014 | 2013 | 2012 | 2011 | 2010 | 2009 | 2008 | 2007 | |
|---|---|---|---|---|---|---|---|---|---|---|---|---|---|---|---|
| 1 | 1,395 | 1,214 | 1,426 | 1,394 | 1,491 | 1,455 | 1,385 | 1,282 | 1,223 | 1,220 | 1,179 | 1,098 | 1,048 | 1,017 | |
| 2 | 11,958 | 13,103 | 12,924 | 12,075 | 11,735 | 12,200 | 12,296 | 11,230 | 10,259 | 10,239 | 10,046 | 7,946 | 7,095 | 8,755 | |
| 3 | 1,806 | 2,576 | 2,302 | 2,233 | 2,646 | 2,261 | 1,982 | 1,954 | 1,899 | 1,606 | 1,757 | 1,342 | 1,125 | 1,179 | |
| 4 | 4 | 17 | 19 | 5 | 0 | 5 | 0 | 14 | 71 | 95 | 111 | 0 | 0 | 0 | |
| 5 | 3,120 | 3,287 | 3,171 | 3,051 | 2,977 | 3,082 | 3,095 | 2,945 | 2,989 | 3,010 | 2,868 | 2,514 | 2,472 | 2,562 | |
| 6 | 0 | -213 | 0 | 0 | 0 | 0 | 0 | 0 | 0 | 0 | 0 | 0 | 0 | 0 | |
| 7 | 0 | 213 | 0 | 0 | 0 | 0 | 0 | 0 | 0 | 0 | 0 | 0 | 0 | 0 | |
| 8 | 0 | 0 | 0 | 0 | 0 | 0 | 0 | 0 | 0 | 0 | -432 | -228 | 0 | 0 | |
| 9 | 1,161 | 1,378 | 1,353 | 1,349 | 1,368 | 1,403 | 1,479 | 1,575 | 1,768 | 1,917 | 1,920 | 1,878 | 0 | 0 | |
| 10 | 0 | 534 | 652 | 595 | 0 | 0 | 0 | 0 | 0 | 0 | 0 | 920 | -425 | 1,008 | |
| 11 | -66 | -95 | -63 | -117 | -54 | -14 | -11 | 31 | -15 | -42 | 4 | 0 | 0 | 0 | |
| 12 | 1,831 | 2,232 | 2,484 | 2,214 | 1,591 | 0 | 0 | 0 | 0 | 0 | 0 | 0 | 0 | 0 | |
| 13 | -297 | -339 | -386 | -734 | -278 | -455 | -545 | -492 | -335 | -377 | -334 | -183 | 333 | -202 | |
| 14 | 0 | 0 | 0 | 0 | 1,036 | 1,232 | 1,457 | 986 | 568 | 693 | 950 | 553 | 0 | 0 | |
| 15 | 0 | 0 | 0 | 0 | 0 | 0 | -2 | -3 | -2 | -60 | -24 | 1 | 0 | 0 | |
| 16 | 1,534 | 1,893 | 2,098 | 1,480 | 1,314 | 1,687 | 2,000 | 1,475 | 901 | 1,010 | 1,260 | 737 | -92 | 806 | |
| 17 | 0 | 0 | 0 | 0 | 0 | -125 | -381 | -141 | 128 | 106 | -163 | -15 | 54 | 8 | |
| 18 | Total Net Income (Loss) Attributable to Parent + | 1,534 | 1,893 | 2,098 | 1,480 | 1,314 | 1,562 | 1,619 | 1,334 | 1,029 | 0 | 1,097 | 722 | -38 | 814 |
| 19 | 0 | 0 | 0 | 181 | 400 | 357 | 425 | 1,334 | 1,029 | 1,116 | 1,097 | 722 | 0 | 0 | |
| 20 | Income (Loss) from Continuing Operations + | 0 | 0 | 0 | 0 | 1,314 | 1,687 | 2,002 | 1,478 | 903 | 1,070 | 1,284 | 736 | 0 | 0 |
| 21 | Total Income (Loss) from Continuing Operations + | 0 | 0 | 0 | 1,480 | 2,628 | 3,249 | 3,623 | 2,815 | 1,934 | 2,246 | 2,405 | 1,457 | 0 | 0 |
| 22 | Income (Loss) from Discontinued Operations + | 0 | 0 | 0 | 0 | 0 | 0 | -2 | -3 | -2 | -60 | -24 | 1 | 0 | 0 |
| 23 | Income (Loss) from Continuing Operations + | 0 | 0 | 0 | 0 | 7.90 | 8.60 | 8.46 | 6.58 | 4.71 | 4.87 | 4.36 | 2.98 | 0 | 0 |
| 24 | 0 | 0 | 0 | 0 | 0 | 0 | -0.01 | -0.02 | -0.01 | -0.25 | -0.10 | 0 | 0 | 0 | |
| 25 | Total Earnings Per Share + | 12.39 | 14.12 | 14.41 | 9.60 | 7.90 | 8.60 | 8.45 | 6.56 | 4.70 | 4.62 | 4.26 | 2.98 | -0.17 | 3.45 |
| 26 | Income (Loss) from Continuing Operations + | 0 | 0 | 0 | 0 | 7.90 | 8.60 | 8.46 | 6.58 | 4.71 | 4.87 | 4.36 | 2.98 | 0 | 0 |
| 27 | Income (Loss) from Continuing Operations + | 0 | 0 | 0 | 0 | 7.81 | 8.48 | 8.31 | 6.46 | 4.63 | 4.77 | 4.27 | 2.95 | 0 | 0 |
| 28 | 0 | 0 | 0 | 0 | 0 | 0 | -0.01 | -0.02 | -0.01 | -0.24 | -0.09 | 0 | 0 | 0 | |
| 29 | Total Earnings Per Share + | 12.20 | 13.92 | 14.20 | 9.44 | 7.81 | 8.48 | 8.30 | 6.44 | 4.62 | 4.53 | 4.18 | 2.95 | -0.17 | 3.39 |
| 30 | 1.04 | 0.97 | 0.90 | 3.24 | 2.92 | 2.59 | 2.26 | 2.01 | 1.15 | 1.15 | 0.71 | 0.68 | 0 | 0 | |
| 31 | 0 | 0 | 0 | 0 | 0 | 0 | 0 | 0 | 0 | 0 | 1.42 | 1.36 | 0.64 | 0.56 |

 Click to Enlarge