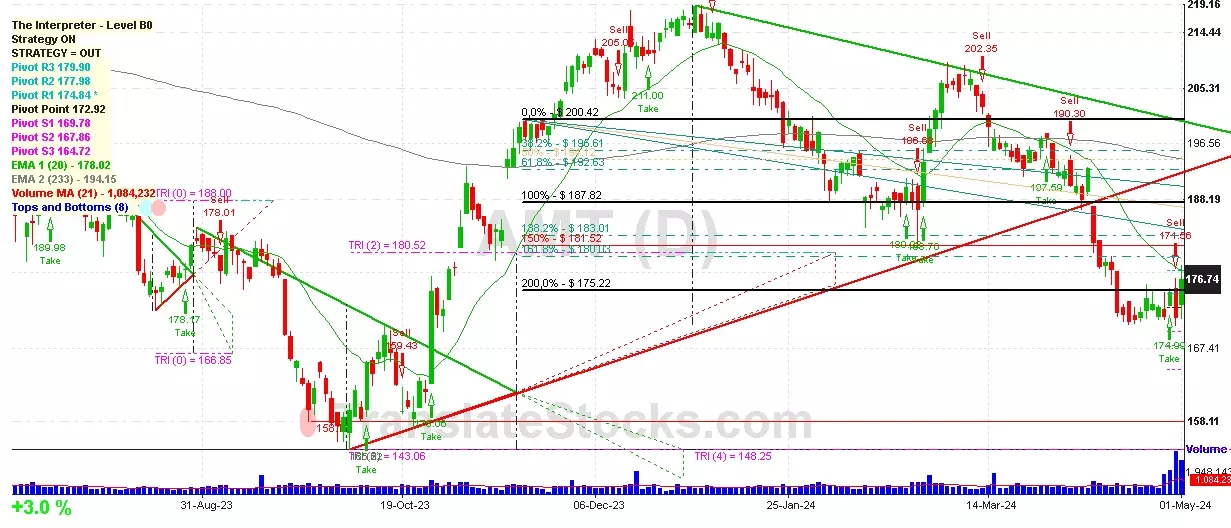
Hey Friend, I'm analysing AMERICAN TOWER CORP (AMT), and it is between the Support of $ 175.22 (200% of Fibonacci) and the Resistance of $ 177.98 (PivotR2). The stock is also approaching the line of PivotR2 at $ 177.98, and if it goes above this line it could reach the next Resistance of 161.8% of Fibonacci at $ 180.03.

| Date | Price $ | Result % | Candle Name | Side |
|---|---|---|---|---|
| 001 01 Apr 2024 | Sell Price: 193.01 | Profit: Open Day1 ($ 191.83) | Abandoned Baby | Sell |
| 002 28 Feb 2024 | Buy Price: 193.76 | Profit: Open Day1 ($ 195.20) | Engulfing | Buy |
| 003 16 Feb 2024 | Sell Price: 187.13 | Profit: Open Day1 ($ 187.09) | Abandoned Baby | Sell |
| 004 14 Feb 2024 | Buy Price: 188.49 | Profit: Open Day1 ($ 189.97) | Abandoned Baby | Buy |
| 005 12 Feb 2024 | Sell Price: 191.77 | Profit: Open Day1 ($ 188.17) | Engulfing | Sell |
| 006 02 Jan 2024 | Buy Price: 218.81 | Loss: Close Day2 ($ 215.57) | Engulfing | Buy |
| 007 15 Dec 2023 | Sell Price: 212.15 | Profit: Open Day1 ($ 212.04) | Abandoned Baby | Sell |
| 008 17 Nov 2023 | Sell Price: 197.74 | Profit: Open Day1 ($ 197.45) | Dark Cloud Cover | Sell |
| 009 05 Oct 2023 | Buy Price: 158.71 | Profit: Close Day1 ($ 159.57) | Engulfing | Buy |
| 010 05 Oct 2023 | Buy Price: 158.63 | Profit: Close Day1 ($ 159.57) | Piercing Line | Buy |
| 011 24 Aug 2023 | Sell Price: 177.15 | Profit: Open Day1 ($ 177.09) | Engulfing | Sell |
| 012 24 Aug 2023 | Sell Price: 177.27 | Profit: Open Day1 ($ 177.09) | Dark Cloud Cover | Sell |
| 013 19 Jul 2023 | Buy Price: 189.11 | Loss: Close Day2 ($ 184.74) | Abandoned Baby | Buy |
| 014One Year Average | Both Sides Result for 13 Signals |
Profit: $ 2.56 ($ 0.20 / Signal) |
All of Them | Buy + Sell |
| Simple Moving Averages (SMA) Period | Value $ | Signal | Exponential Moving Averages (EMA) Period | Value $ | Signal | |
|---|---|---|---|---|---|---|
| 2 | 174.15 | BUY | 2 | 175.30 | BUY | |
| 3 | 174.43 | BUY | 3 | 174.69 | BUY | |
| 5 | 173.58 | BUY | 5 | 174.15 | BUY | |
| 8 | 173.46 | BUY | 8 | 174.18 | BUY | |
| 13 | 173.26 | BUY | 13 | 175.47 | BUY | |
| 21 | 178.38 | SELL | 21 | 178.39 | SELL | |
| 34 | 184.89 | SELL | 34 | 182.43 | SELL | |
| 55 | 189.20 | SELL | 55 | 186.56 | SELL | |
| 90 | 195.30 | SELL | 90 | 189.56 | SELL | |
| 200 | 188.75 | SELL | 200 | 192.79 | SELL |
American Tower Corp
IPO: 2012-01-03
Ticker: AMTIndices: S&P 500,
Exchange: New York Stock Exchange, Inc. (US - USD)
Website: http://www.americantower.com/
Phone:
REIT (Real Estate Investment Trust)
Real Estate & Construction (
Real Estate Investment Trusts
 Click to Enlarge