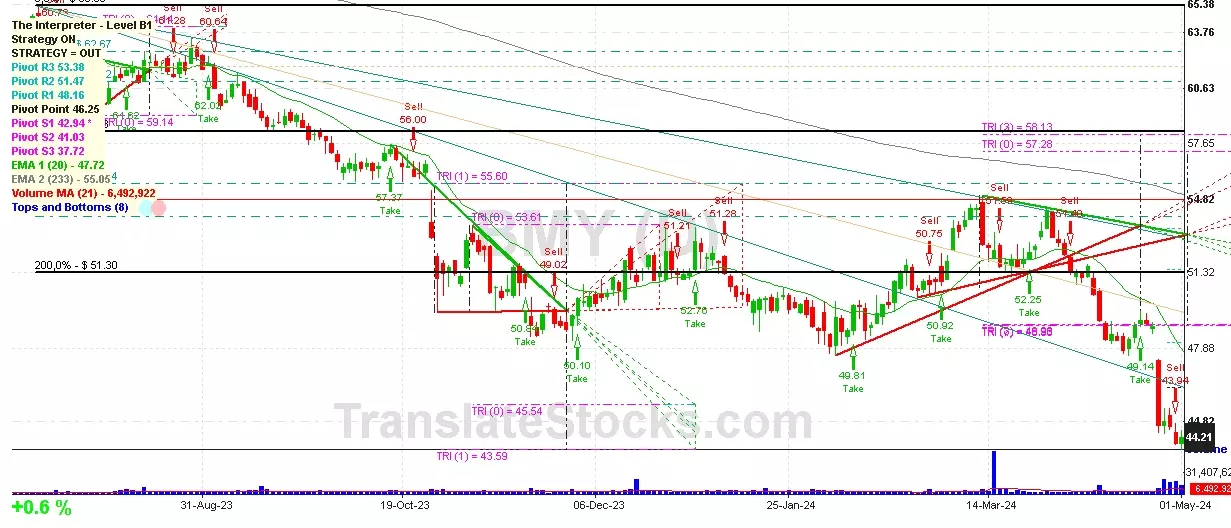
| Date | Price $ | Result % | Candle Name | Side |
|---|---|---|---|---|
| 001 21 Mar 2024 | Sell Price: 51.59 | Loss: Close Day2 ($ 52.26) | Engulfing | Sell |
| 002 25 Jan 2024 | Sell Price: 49.61 | Loss: Close Day2 ($ 49.87) | Engulfing | Sell |
| 003 27 Nov 2023 | Sell Price: 49.02 | Profit: Close Day1 ($ 48.92) | Abandoned Baby | Sell |
| 004 09 Aug 2023 | Buy Price: 60.74 | Profit: Open Day1 ($ 61.09) | Engulfing | Buy |
| 005 09 Aug 2023 | Buy Price: 60.62 | Profit: Open Day1 ($ 61.09) | Piercing Line | Buy |
| 006One Year Average | Both Sides Result for 5 Signals |
Loss: $ -0.00 ($ -0.00 / Signal) |
All of Them | Buy + Sell |
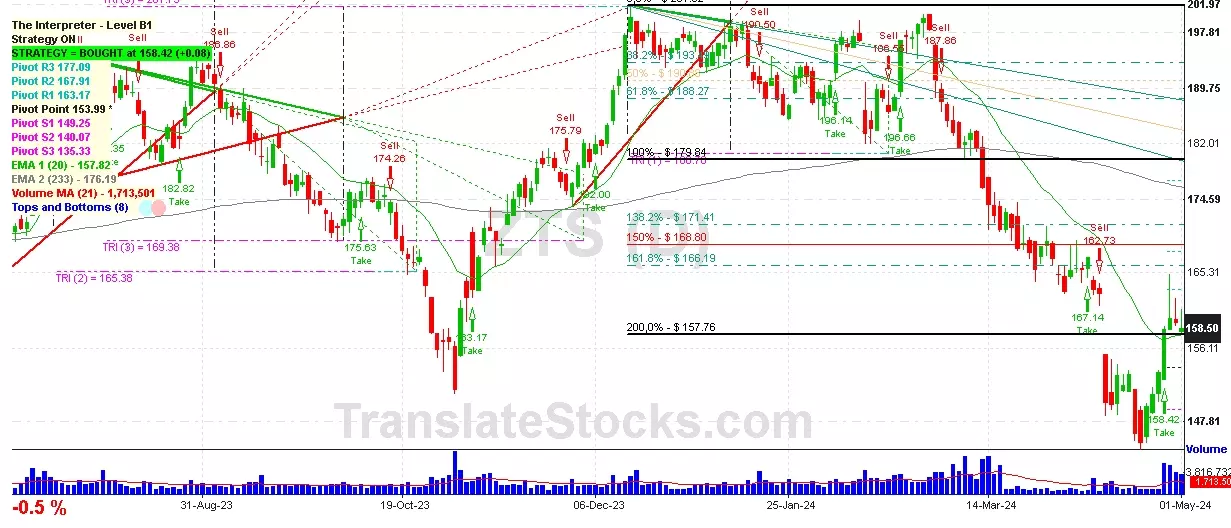
| Simple Moving Averages (SMA) Period | Value $ | Signal | Exponential Moving Averages (EMA) Period | Value $ | Signal | |
|---|---|---|---|---|---|---|
| 2 | 44.07 | BUY | 2 | 44.22 | SELL | |
| 3 | 44.26 | SELL | 3 | 44.40 | SELL | |
| 5 | 44.47 | SELL | 5 | 44.93 | SELL | |
| 8 | 46.17 | SELL | 8 | 45.69 | SELL | |
| 13 | 47.01 | SELL | 13 | 46.70 | SELL | |
| 21 | 48.40 | SELL | 21 | 47.83 | SELL | |
| 34 | 49.94 | SELL | 34 | 48.87 | SELL | |
| 55 | 50.49 | SELL | 55 | 49.68 | SELL | |
| 90 | 50.43 | SELL | 90 | 50.62 | SELL | |
| 200 | 53.84 | SELL | 200 | 54.10 | SELL |
Bristol-myers Squibb Co
IPO: 1929-07-05
Ticker: BMYIndices: S&P 500,
Exchange: New York Stock Exchange, Inc. (US - USD)
Website: https://www.bms.com/
Phone:
Common Stock
Life Sciences (
Pharmaceutical Preparations
 Click to Enlarge