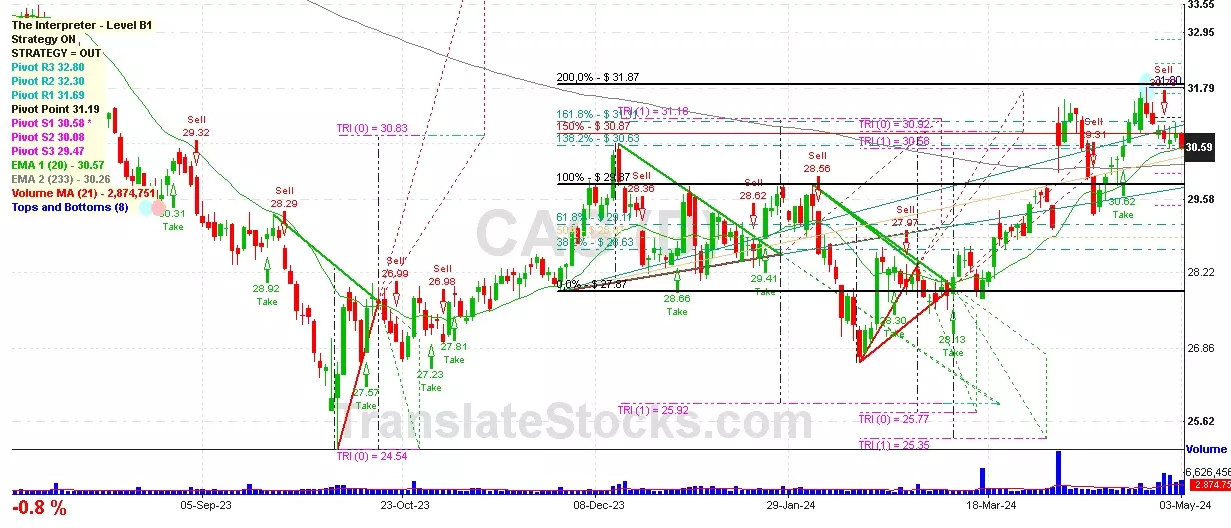
Hey Friend, I'm analysing CONAGRA BRANDS INC (CAG), and it is between the Support of $ 30.58 (PivotS1) and the Resistance of $ 30.63 (138.2% of Fibonacci). The stock is also approaching the line of PivotS1 at $ 30.58, and if it goes below this line it could reach the next Support of 100% of Fibonacci at $ 29.87.

| Date | Price $ | Result % | Candle Name | Side |
|---|---|---|---|---|
| 001 26 Mar 2024 | Sell Price: 28.91 | Loss: Close Day2 ($ 29.64) | Engulfing | Sell |
| 002 07 Mar 2024 | Sell Price: 27.80 | Loss: Close Day2 ($ 28.53) | Engulfing | Sell |
| 003 26 Jan 2024 | Sell Price: 29.62 | Profit: Open Day1 ($ 29.35) | Dark Cloud Cover | Sell |
| 004 08 Jan 2024 | Buy Price: 28.73 | Profit: Close Day1 ($ 29.32) | Engulfing | Buy |
| 005 21 Nov 2023 | Buy Price: 28.20 | Profit: Open Day1 ($ 28.36) | Abandoned Baby | Buy |
| 006 14 Nov 2023 | Buy Price: 28.02 | Profit: Close Day1 ($ 28.15) | Abandoned Baby | Buy |
| 007 10 Nov 2023 | Sell Price: 27.81 | Profit: Open Day1 ($ 27.72) | Engulfing | Sell |
| 008 06 Oct 2023 | Buy Price: 26.41 | Profit: Open Day1 ($ 26.42) | Abandoned Baby | Buy |
| 009 15 May 2023 | Sell Price: 36.52 | Profit: Open Day1 ($ 36.45) | Engulfing | Sell |
| 010 15 May 2023 | Sell Price: 36.54 | Profit: Open Day1 ($ 36.45) | Dark Cloud Cover | Sell |
| 011One Year Average | Both Sides Result for 10 Signals |
Loss: $ -0.05 ($ -0.00 / Signal) |
All of Them | Buy + Sell |
| Simple Moving Averages (SMA) Period | Value $ | Signal | Exponential Moving Averages (EMA) Period | Value $ | Signal | |
|---|---|---|---|---|---|---|
| 2 | 30.72 | SELL | 2 | 30.66 | SELL | |
| 3 | 30.72 | SELL | 3 | 30.70 | SELL | |
| 5 | 30.78 | SELL | 5 | 30.77 | SELL | |
| 8 | 30.98 | SELL | 8 | 30.80 | SELL | |
| 13 | 30.88 | SELL | 13 | 30.74 | SELL | |
| 21 | 30.70 | SELL | 21 | 30.54 | BUY | |
| 34 | 30.14 | BUY | 34 | 30.18 | BUY | |
| 55 | 29.33 | BUY | 55 | 29.78 | BUY | |
| 90 | 29.10 | BUY | 90 | 29.49 | BUY | |
| 200 | 29.08 | BUY | 200 | 30.00 | BUY |
Conagra Brands Inc
IPO: 1973-01-09
Ticker: CAGIndices: S&P 500,
Exchange: New York Stock Exchange, Inc. (US - USD)
Website: https://www.conagrabrands.com/
Phone:
Common Stock
Manufacturing (
Food And Kindred Products
 Click to Enlarge