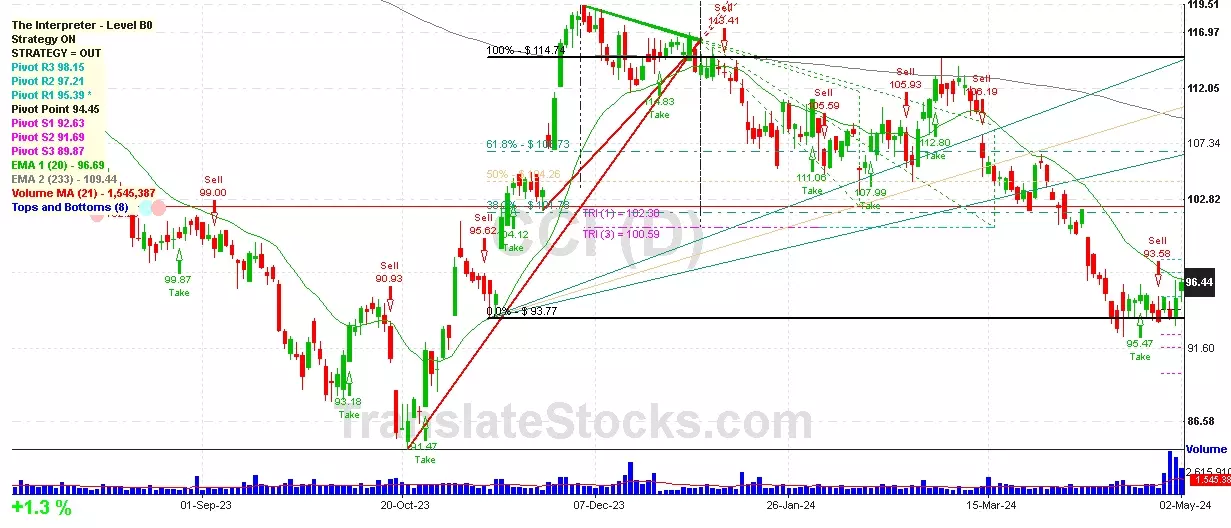
Hey Friend, I'm analysing CROWN CASTLE INTL CORP (CCI), and it is between the Support of $ 95.39 (PivotR1) and the Resistance of $ 97.21 (PivotR2). The stock is also approaching the line of PivotR2 at $ 97.21, and if it goes above this line it could reach the next Resistance of Triangle projection at $100.59.

| Date | Price $ | Result % | Candle Name | Side |
|---|---|---|---|---|
| 001 01 Apr 2024 | Sell Price: 104.26 | Profit: Open Day1 ($ 103.44) | Abandoned Baby | Sell |
| 002 11 Mar 2024 | Sell Price: 112.26 | Profit: Open Day1 ($ 111.75) | Abandoned Baby | Sell |
| 003 19 Dec 2023 | Buy Price: 113.99 | Profit: Open Day1 ($ 115.02) | Abandoned Baby | Buy |
| 004 14 Nov 2023 | Buy Price: 101.37 | Profit: Close Day1 ($ 103.26) | Abandoned Baby | Buy |
| 005 24 Jul 2023 | Buy Price: 111.47 | Profit: Open Day1 ($ 111.66) | Abandoned Baby | Buy |
| 006One Year Average | Both Sides Result for 5 Signals |
Profit: $ 4.44 ($ 0.89 / Signal) |
All of Them | Buy + Sell |
| Simple Moving Averages (SMA) Period | Value $ | Signal | Exponential Moving Averages (EMA) Period | Value $ | Signal | |
|---|---|---|---|---|---|---|
| 2 | 95.85 | BUY | 2 | 95.93 | BUY | |
| 3 | 95.16 | BUY | 3 | 95.60 | BUY | |
| 5 | 94.87 | BUY | 5 | 95.29 | BUY | |
| 8 | 94.94 | BUY | 8 | 95.20 | BUY | |
| 13 | 94.70 | BUY | 13 | 95.62 | BUY | |
| 21 | 96.31 | BUY | 21 | 96.85 | SELL | |
| 34 | 99.25 | SELL | 34 | 98.88 | SELL | |
| 55 | 103.11 | SELL | 55 | 101.19 | SELL | |
| 90 | 106.06 | SELL | 90 | 103.13 | SELL | |
| 200 | 103.41 | SELL | 200 | 107.60 | SELL |
Crown Castle Intl Corp
IPO: 2001-04-25
Ticker: CCIIndices: S&P 500,
Exchange: New York Stock Exchange, Inc. (US - USD)
Website: http://www.crowncastle.com/
Phone:
REIT (Real Estate Investment Trust)
Real Estate & Construction (
Real Estate Investment Trusts
 Click to Enlarge